Choosing the right chart type can make a major difference in how you interpret market movement. This is the core concept when learning to trade futures, stocks, and equities.
Two of the most common approaches used by active traders are time-based charts and range charts. Both can display the same market, but they organize price action in very different ways.
In this guide, we’ll compare a 1-minute time chart with a 10-range chart, explain how each one works, and show when each may be more useful for day trading.
We’ll also look at how DayTradeToWin tools such as the Trade Scalper and Sonic System can be used on both chart types.
What Is a Time Chart?
A time chart creates a new candle after a specific amount of time has passed.
For example, on a 1-minute chart, each candle represents exactly 60 seconds of market activity.
Every minute:
- A candle opens
- Price moves up and down
- A high and low are created
- The candle closes
- A new candle begins
The amount of price movement during that minute does not determine when the candle ends.
A candle could move only a few ticks or several points. Either way, once 60 seconds has passed, the next candle begins.
This makes time charts useful for traders who want to understand how price behaves over a fixed period.
What Is a Range Chart?
A range chart works very differently.
Instead of creating candles based on time, a range chart creates candles based primarily on price movement.
For example, if you use a 10-range chart, the candle is built around a predefined 10-tick price range.
On the E-mini S&P 500 and Micro E-mini S&P 500:
10 ticks = 2.5 points
This means the chart focuses on movement rather than the amount of time that has passed.
A range candle could form in:
- 10 seconds
- 30 seconds
- 2 minutes
- 10 minutes
The important factor is price movement.
Time Charts vs. Range Charts: The Main Difference
The simplest way to understand the difference is this:
Time charts are controlled by time.
Range charts are controlled by price movement.
That distinction can dramatically change how a chart looks.
On a 1-minute chart, candles continue to appear even if the market is moving very little.
On a range chart, the chart may remain on the same candle for a long period if price does not travel far enough.
Why Time Does Not Matter the Same Way on a Range Chart
One of the most important things to understand about range charts is that time is not what causes the next candle to form.
If the market barely moves, several minutes can pass without meaningful chart development.
This can help remove some of the visual noise that appears on a time chart during slow trading conditions.
For example, a 1-minute chart might show 10 or 15 candles while price remains stuck inside a small range.
A range chart may represent that same period with only one or two candles.
That can make it easier to see whether meaningful price movement is actually occurring.
Why Traders Use 10-Range Charts
There is no single range setting that is perfect for every market or trader, but a 10-range chart can be a useful starting point for E-mini and Micro E-mini traders.
On ES and MES:
10 ticks = 2.5 points
That gives traders a consistent way to visualize movement.
Every completed range candle represents a fixed amount of price activity rather than a fixed amount of time.
This can make trends and directional movement easier to see.
What Happens During High Volatility?
Range charts can be very useful, but they can also become extremely fast during volatile markets.
When price is moving aggressively, multiple range candles may form very quickly.
That can create a different problem.
Instead of waiting for a candle every minute, you might see several candles appear within seconds.
When that happens, traders may have less time to:
- Recognize a setup
- Analyze a signal
- Decide whether to enter
- Place an order
- Manage risk
This is why a range chart is not automatically better than a time chart.
The speed of the market still matters.
What Happens During Slow Markets?
Slow markets reveal one of the biggest differences between these two chart types.
On a 1-minute chart
Candles continue to form every minute.
You may see:
- Many candles
- Small bodies
- Repeated highs and lows
- Very little directional movement
The chart can look busy even though the market is not actually going anywhere.
On a range chart
If price does not move far enough, a candle may remain active for a long time.
You may see one candle lasting several minutes.
That tells you something important:
The market is not moving enough to complete the required range.
Both chart types can identify slow conditions, but they show them differently.
Which Chart Is Better for Support and Resistance?
Time charts can be particularly useful when evaluating support and resistance.
Because candles continue to form at fixed intervals, traders may see repeated tests of the same price area more clearly.
For example, if price spends 15 minutes moving sideways inside a tight range, a 1-minute chart may display 15 candles showing repeated interaction with the same support and resistance levels.
That can make consolidation visually obvious.
A range chart may show fewer candles during the same period.
That is not necessarily worse. It simply presents the same information through price movement rather than elapsed time.
Which Chart Is Better for Price Movement?
Range charts can be particularly helpful when the trader wants to focus on distance traveled.
Each candle represents a consistent amount of movement.
That makes it easier to visually evaluate:
- Trend progression
- Pullbacks
- Momentum
- Price swings
- Directional movement
A trader looking primarily at price action may find this useful because time becomes less dominant in the chart structure.
Can You Use Trading Indicators on Range Charts?
Yes.
Many indicators and trading systems can be used on range charts as well as time-based charts.
In the accompanying video, we demonstrate this using DayTradeToWin tools including:
and
The important point is that the signals are being displayed within a different chart structure.
The underlying market is still the same.
What changes is how the price information is organized.
Should You Trade a 1-Minute Chart or a Range Chart?
Instead of asking:
“Which chart is better?”
A more useful question may be:
“What is the market doing on this chart right now?”
Consider:
- Is the market moving too quickly?
- Is the market barely moving?
- Are candles forming too fast to react?
- Is price stuck inside a narrow range?
- Is there enough movement to justify a trade?
- Are signals appearing during meaningful movement?
A chart is only useful if it helps you understand the current market condition.
Using Time Charts and Range Charts Together
One approach is to monitor both chart types at the same time.
For example:
A 1-minute chart can help you understand how long the market has been trading in a certain area.
A 10-range chart can help you understand how far the market has actually moved.
Together, they provide two perspectives:
Time + Distance
This can be particularly helpful when determining whether the market is:
- Trending
- Range-bound
- Slow
- Highly volatile
- Producing actionable trading signals
Instead of treating the two chart types as competitors, traders can use them as complementary tools.
Example: 1 minute chart after 10 Minutes on a Time Chart
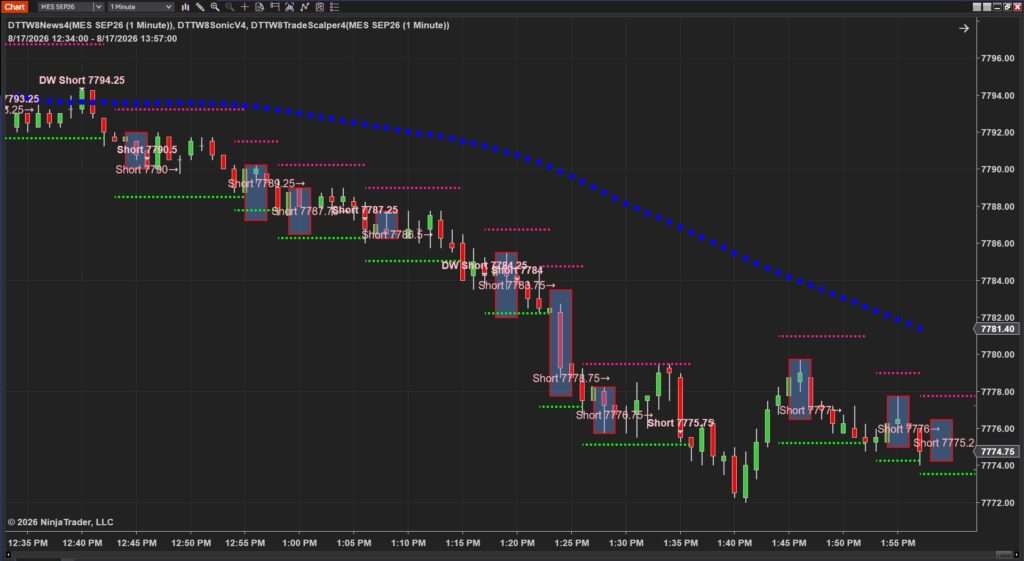
Consider a 1-minute chart showing 10 candles.
You immediately know approximately 10 minutes have passed.
However, those 10 candles might represent:
- A strong directional move
or
- Almost no movement at all
The number of candles does not tell you how far price traveled.
The Same 10 Minutes on a Range Chart
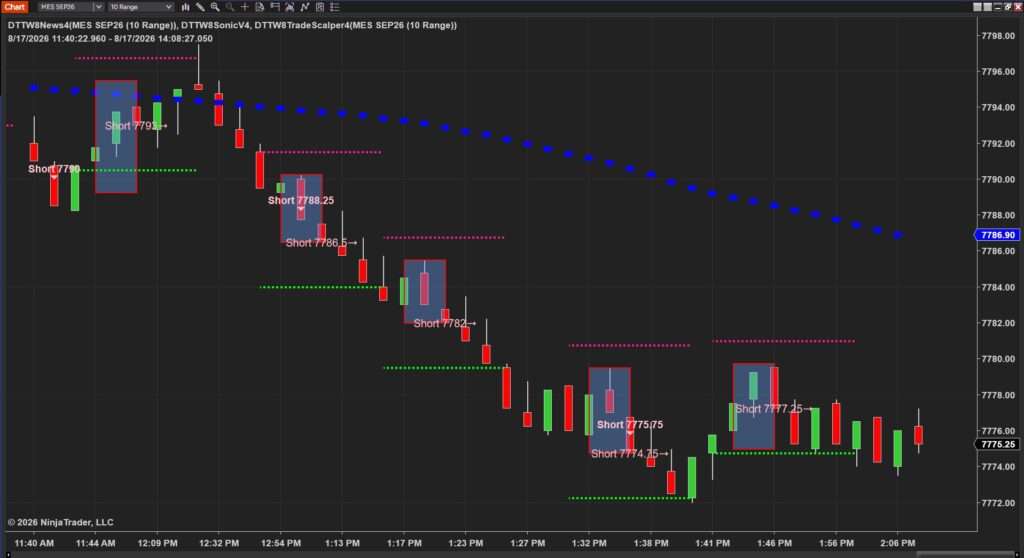
Now consider the same 10-minute period on a range chart.
If the market is moving quickly, many range candles may form.
If the market is slow, perhaps only one candle forms.
This gives the trader immediate information about actual price movement.
That is one of the biggest advantages of understanding both chart types.
Range Charts Can Help Reduce Visual Noise
Time-based charts continuously produce candles.
During slow periods, this can make the chart appear more active than the market really is.
Range charts can reduce some of that visual noise because new candles require a specific amount of price movement.
This may help traders focus more directly on movement rather than elapsed time.
However, range charts are not automatically superior.
During extremely volatile conditions, the opposite can happen.
Range candles may form extremely quickly and make trading more difficult.
There Is No Perfect Chart
There is no single chart setting that works perfectly in every market condition.
A 1-minute chart can be useful.
A 10-range chart can be useful.
A trader’s goal should be to understand what information each chart provides.
The chart itself does not create the trade.
It is simply a way of organizing market information.
Understanding the relationship between time, distance, volatility, and price action can help traders make more informed decisions.
Watch the Full Video
In the video, we demonstrate these differences directly using live chart examples.
You’ll see:
- How a 1-minute chart creates candles
- How a 10-range chart creates candles
- How the same market can look different on each
- How slow conditions appear
- How volatility affects range charts
- How Trade Scalper signals appear
- How Sonic System signals appear
- How traders can use both chart types together
If you trade futures using NinjaTrader or TradingView, understanding this distinction can help you better interpret price action.
Visit DayTradeToWin.com to learn more about our price action trading software, trading education, and indicators.
Frequently Asked Questions
What is the difference between a time chart and a range chart?
A time chart creates candles after a fixed amount of time, such as every 1 minute. A range chart creates candles based primarily on a predefined amount of price movement.
What is a 10-range chart?
A 10-range chart uses a 10-tick price range for its candles. On the E-mini S&P 500 and Micro E-mini S&P 500, 10 ticks equals 2.5 points.
Are range charts better for day trading?
Not necessarily. Range charts can make price movement easier to visualize, but during high volatility the candles can form extremely quickly. Time charts and range charts each have advantages depending on market conditions.
Are 1-minute charts good for day trading?
A 1-minute chart can be useful for short-term trading because it provides consistent time-based information. It can also help traders visualize support, resistance, consolidation, and how long price has remained in a particular area.
Does time matter on a range chart?
Time does not determine when the next range candle forms. Price must move enough to satisfy the selected range setting before a new candle is created.
Can DayTradeToWin software work on range charts?
Yes. DayTradeToWin software can be used with supported time-based and range chart configurations. Individual software settings and platform compatibility should always be confirmed for the specific product being used.
Can I use range charts in NinjaTrader?
Yes. NinjaTrader supports range-based chart types in addition to traditional time-based charts.
Can I use both range charts and time charts?
Yes. Some traders use both simultaneously because one emphasizes elapsed time while the other emphasizes price movement.
DayTradeToWin Risk Disclaimer
Important Risk Disclosure: Trading futures, stocks, forex, cryptocurrencies, and other financial markets involves substantial risk and is not suitable for every investor. You can lose some or all of your trading capital.
Any charts, trading signals, strategies, indicators, software demonstrations, hypothetical examples, or educational discussions presented by DayTradeToWin are provided for educational and informational purposes only.
Nothing contained in this article or accompanying video should be interpreted as financial advice, investment advice, a recommendation to buy or sell any financial instrument, or a guarantee of future trading performance.
Past performance is not necessarily indicative of future results. Hypothetical or simulated performance results have inherent limitations and may differ substantially from actual trading results.
Always evaluate your own financial circumstances, experience, and risk tolerance before trading.

John Paul is the founder of DayTradeToWin, a trading education and software platform established in 2008 with thousands of members worldwide. He specializes in price action-based futures trading strategies and structured market analysis.
DayTradeToWin provides trading education, indicators, and software tools designed to help traders apply disciplined, rule-based price action decision-making across global futures markets.
John Paul is the creator of several trading methodologies, including the Sonic System, Atlas Line, and Trade Scalper, used by traders to identify structured opportunities in markets such as the E-mini S&P 500 (ES), Nasdaq (NQ), crude oil (CL), and gold (GC).
Official website: https://daytradetowin.com