Are You Picking Tops and Bottoms? Use Price Action.
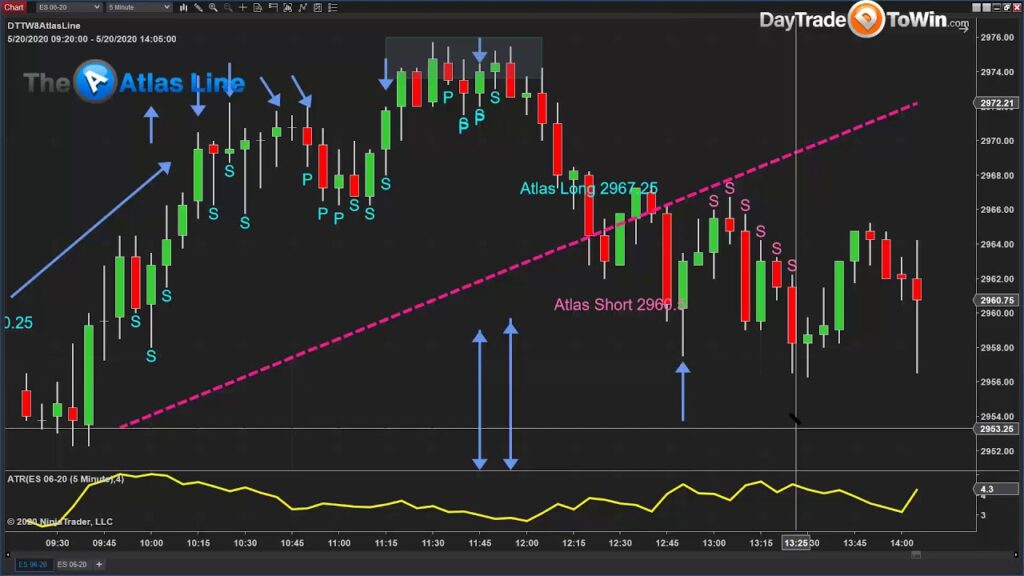
Generally, picking tops and bottoms (highs and lows) is not the best way to trade. However, you can learn how to identify Yo-Yo Bars to help your trading. In the video, you’ll see a group of candles representing a period where price “tried and failed” to reach higher levels. Price kept hitting an invisible ceiling […]
Advanced Day Trading Techniques You Should Know Pt. 1
Here’s a recent live webinar recording where John Paul shares his live charts. Right away, you can see a great Short signal produced by the Trade Scalper software! Our approach is based on price action. We like to let the market “prove” to us that it intends to move up or down. Our risk (profit […]
Today’s Trade Scalper & Atlas Line (Winning) Signals
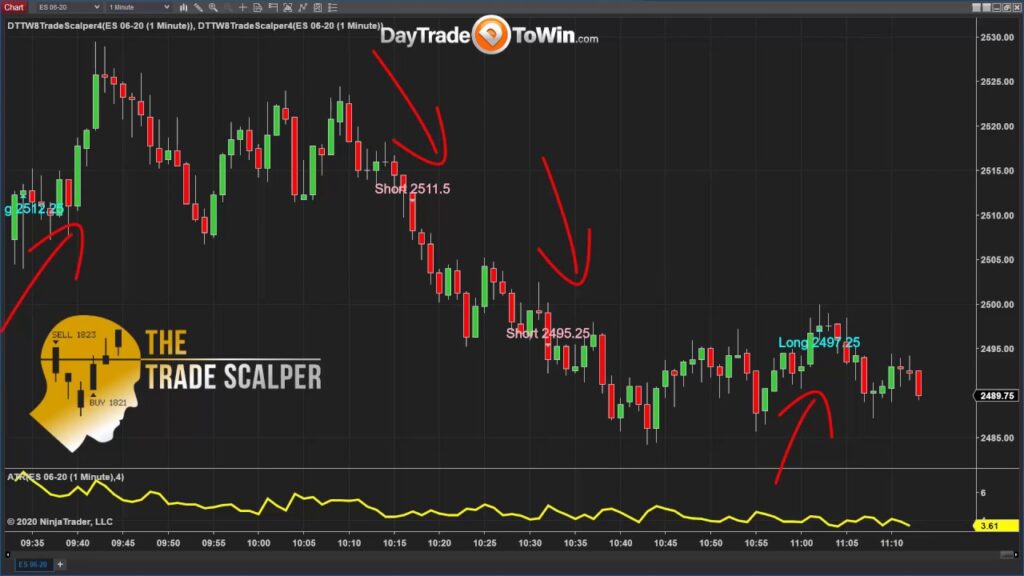
Take a look at these winning trades! First, we begin with a 1-min chart using the Atlas Line. Once price crossed below the Atlas Line and closed twice, all of the signals were short (sell). These were good signals because the price fell soon after. Likewise, when price passes through the Atlas Line and closes […]
Two Great 3-Point E-mini Scalping Trades
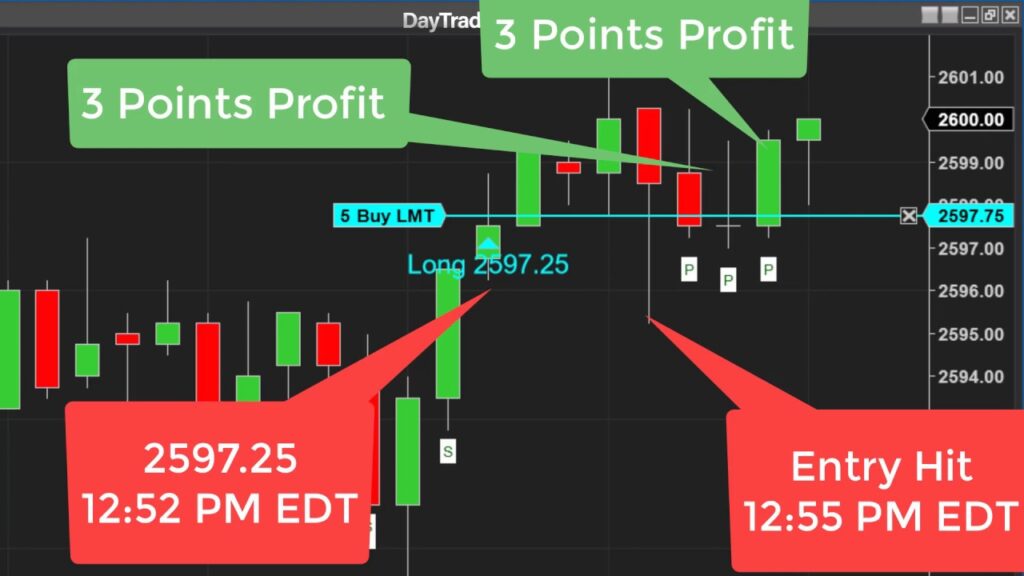
This video begins with a Long (buy) price action trading signal from the Trade Scalper. The E-mini S&P 500 (ES in NinjaTrader) is being traded here on a 1-Minute chart. As such, John Paul places a buy/long order using the NinjaTrader SuperDOM. On the bottom of the chart, you’ll see the ATR (Average True Range). […]
Volatile Price Action Signals: Trade Scalper & Atlas Line

As a reminder, we provide a full training video for either product you decide to go with: the Atlas Line or Trade Scalper. If you prefer to get both and a bunch of other trading methods in one complete package, join our eight-week Mentorship Program. Mentorship teaches everything we have, which totals to about 10 […]
Scalping Rules for Risk & Reward
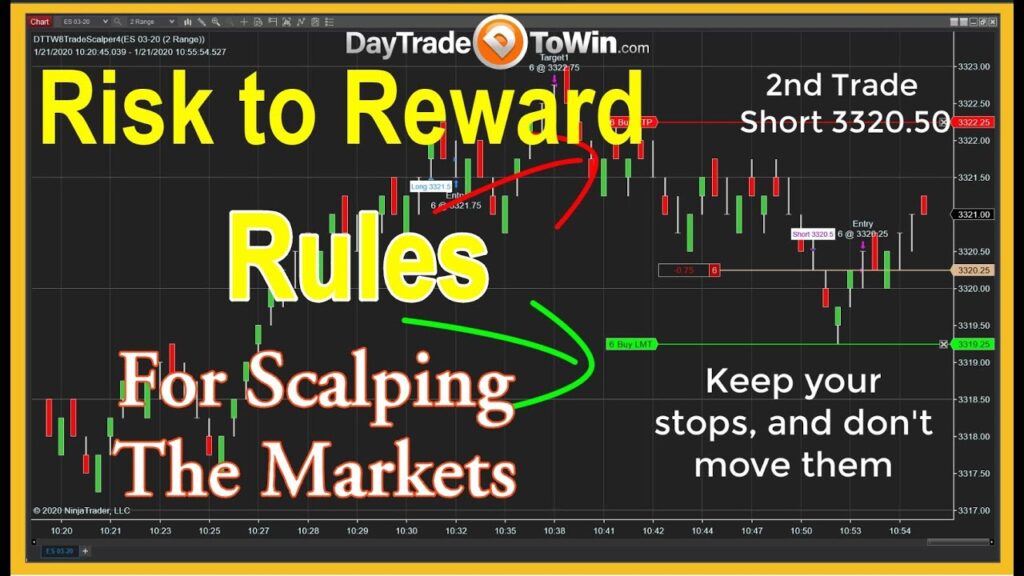
Get the Trade Scalper signals on your chart today! At the start of the video, take a look at the two nice Trade Scalper signals using a 2-Range chart with NinjaTrader. On a 2-Range chart, each bar (aka candle) represents 2 ticks of ranging price activity over time (however long it takes to plot each […]