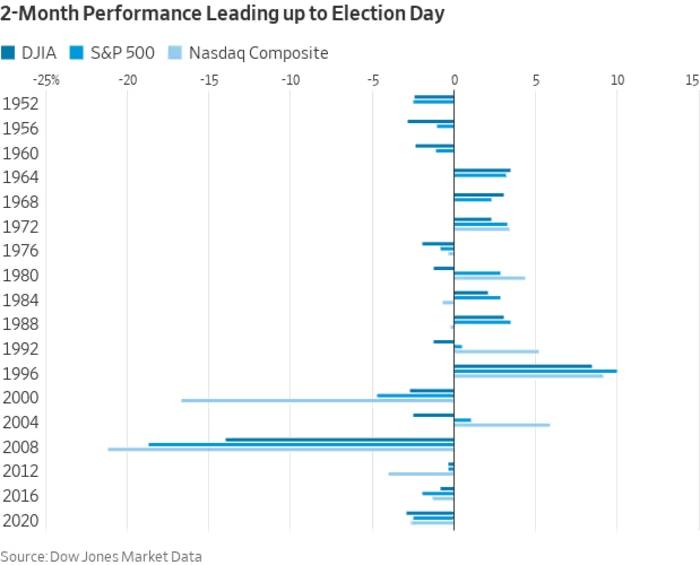
Since 2008, the S&P 500 has consistently fallen during the two-month lead-up to the U.S. presidential election, averaging a 5.8% decline, according to Dow Jones Market Data.
Historically, dating back to 1952, the S&P 500 has shown a slight average drop of 0.2% in this pre-election period, though the median gain is 0.1%, with an even split between gains and losses.
Despite these patterns, investment experts caution that past performance is not a guarantee of future results.
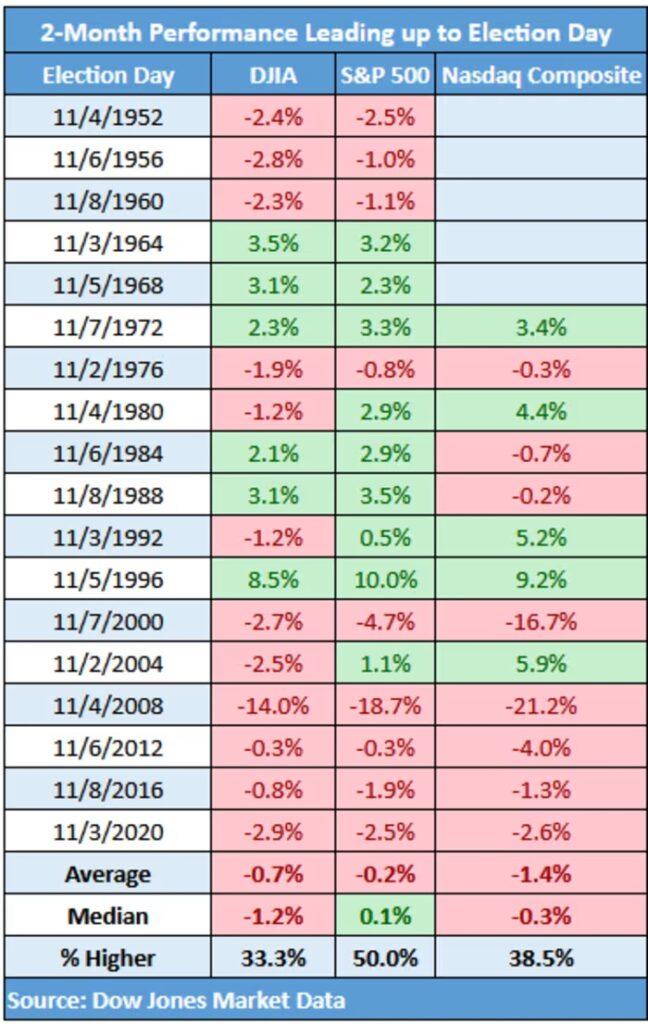
Both the Dow Jones Industrial Average and Nasdaq Composite have also tended to dip during the same period, with the Dow rising only a third of the time, and the Nasdaq 38.5% of the time since 1972.
September is traditionally a weak month, with an average drop of 0.78% since 1944, and election years bring added pressure, often extending declines into October.
During presidential election years, September has seen an average fall of 0.51%, while October, which typically gains 1.04%, has turned into a down month with an average decline of 0.45%.

