Cautionary advice from analysts at Ned Davis Research on Wednesday suggests that optimistic stock-market investors should exercise restraint before indulging in expectations of a “Santa Claus rally.
Bullish sentiment, gauged by a pair of NDR indicators, has reached the “excessive” zone, a potential contrary indicator that aligns with the historical tendency for a weak first-half December performance in the stock market, according to Ed Clissold, Chief U.S. Strategist, and London Stockton, Research Analyst.
The Short-Term NDR Daily Trading Sentiment Composite, incorporating over 20 indicators such as the Cboe Volatility Index (VIX) and trader polls, recently attained its most optimistic level since July 25, maintaining an optimistic 76.7, they noted. Additionally, NDR’s crowd sentiment poll, with a more intermediate-term outlook, returned to optimistic territory for the first time since August.
This positive sentiment follows the S&P 500’s impressive 8.9% surge in November, marking its best monthly gain since July 2022 and the sixth-best November performance since 1926. The analysts attribute November’s market gains to a decline in the benchmark 10-year Treasury yield from its 5% peak in October. However, the rise in sentiment levels, signaling a potential pullback, aligns with the historical pattern of weakness in the stock market during the first half of December.
Clissold and Stockton highlighted that this weakness might surprise investors who anticipate strong stock-market performance in November and December, historically the best back-to-back months for the market.
The analysts attribute part of the anticipation to the hype surrounding the “Santa Claus” rally, a term referring to a specific window of trading days around Christmas. They noted that some on Wall Street use the term more loosely, likening it to shoppers lamenting early Christmas decorations in stores.
While the term typically refers to the market’s tendency to rise in the final five trading days of the calendar year and the first two trading days of the following year, Clissold and Stockton pointed out the variability in interpretations.

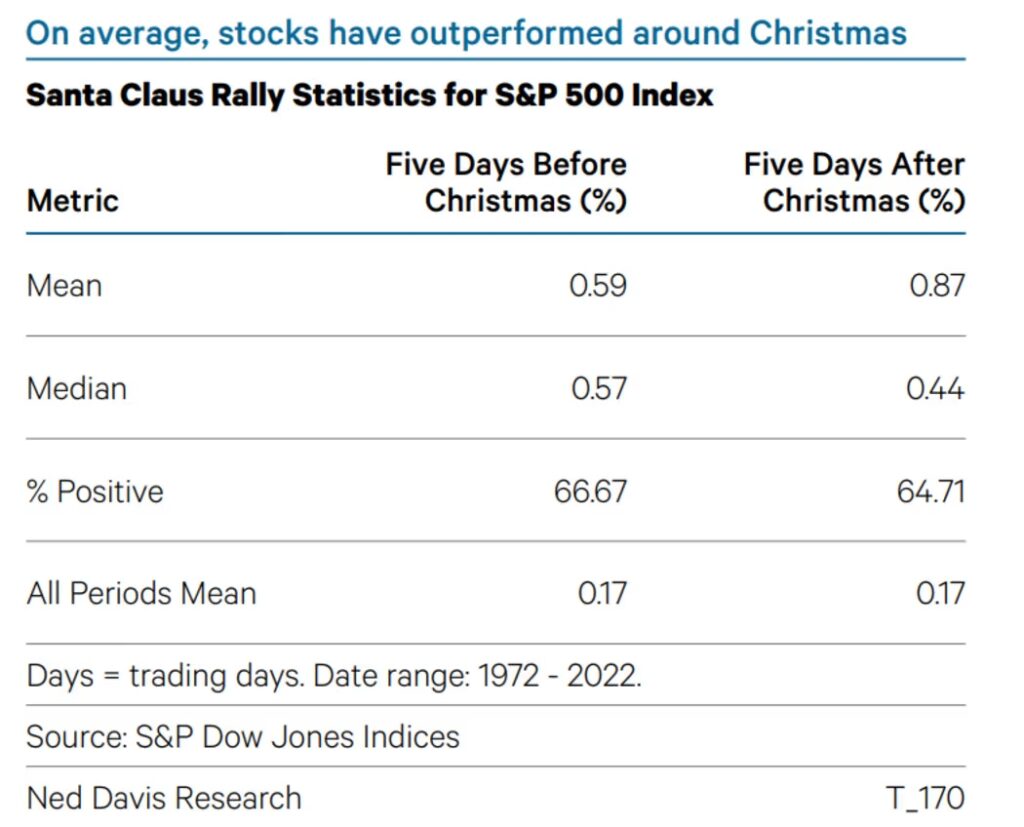
They presented historical data showing the S&P 500’s average gains of 0.59% in the five days before Christmas and 0.87% in the five days after Christmas, compared to a 0.17% average gain for all five-day periods since 1972.
In a somewhat optimistic tone, the analysts suggested that a seasonal pullback, relieving short-term optimism, could potentially set the stage for a true Santa Claus rally in the holiday season.


