Reflecting on One Year Since the Bear-Market Low
Not everyone’s popping the champagne as we mark the first anniversary of the S&P 500’s bear-market low on Oct. 12, 2022. The big benchmark rebounded from the bear-market pit on June 8, surging more than 20% from that October low — a significant milestone in the eyes of many experts.
The question of whether it’s officially a new bull market or not remains a matter of debate. Some believe it began in June, retroactively from the October low. Others are waiting for the S&P 500 to conquer its previous high from January 2022 before declaring a new bull. And there are those with extensive checklists to meet before making that announcement.
Regardless, this anniversary provides an opportunity to assess the stock market’s performance since that bear-market low. To some, if it’s a bull market, it hasn’t had the most robust start.
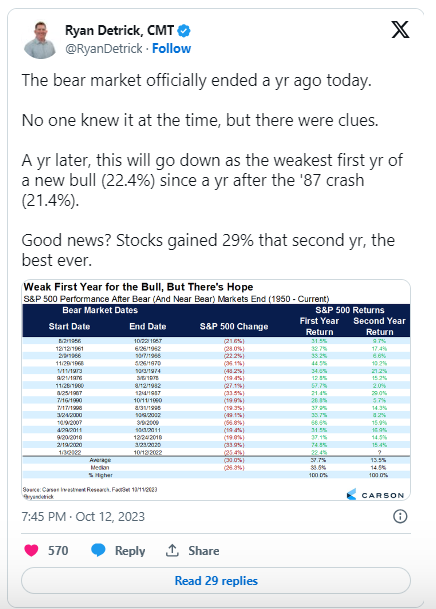
Ryan Detrick, Chief Market Strategist at Carson Group, points out that the S&P 500’s 22.4% gain during its first year is weaker than the median first-year gain of 33.5% based on data going back to 1956. However, there’s a silver lining — the S&P 500 surged by 29% during the second year of the post-1987 rally, the most robust in history.

Despite recent efforts to stabilize, the S&P 500’s pullback of less than 10% from its 2023 high set on June 30 has cast a shadow. Some skeptics speculate the bull market might have already ended due to factors like rising interest rates, oil prices, bond yields, and a strengthening U.S. dollar.
Sam Stovall, Chief Investment Strategist at CFRA, notes that every S&P 500 bull market since 1949 only concluded after completely recovering from the prior bear market’s losses. The current bull has only retraced 83% of its fall.
Stovall believes the bull still has momentum, citing that there have been only three “bogus bulls” since World War II, and historically, positive S&P 500 returns through September have led to full-year gains 96% of the time.
However, how you feel about this bull market might depend on the circles you move in. The stock-market rally continues to be led by a handful of mega-cap tech stocks. An equal-weighted measure of the S&P 500 shows more modest gains of just over 11% in the past year.
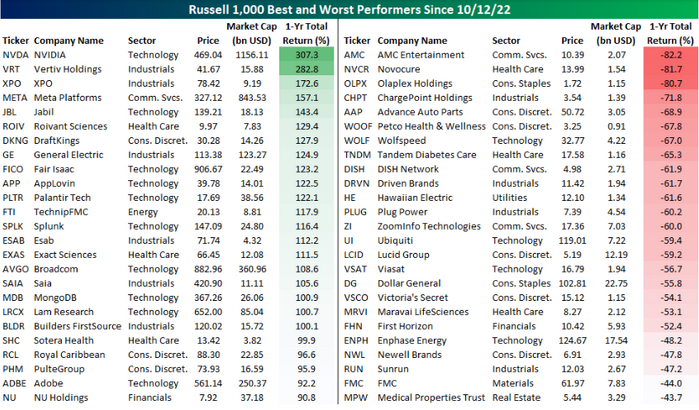
Take a look at the chart below to see the top 25 best- and worst-performing stocks in the large-cap Russell 1000 index since October 12 last year:

The average stock in the index has increased about 15% over the year, but the chart shows winners surging 90% or more while losers fell over 40%.
The question remains: Were you lucky enough to own the big winners and avoid the big losers in this market rollercoaster?


