How to Filter Out Overbought or Oversold Conditions
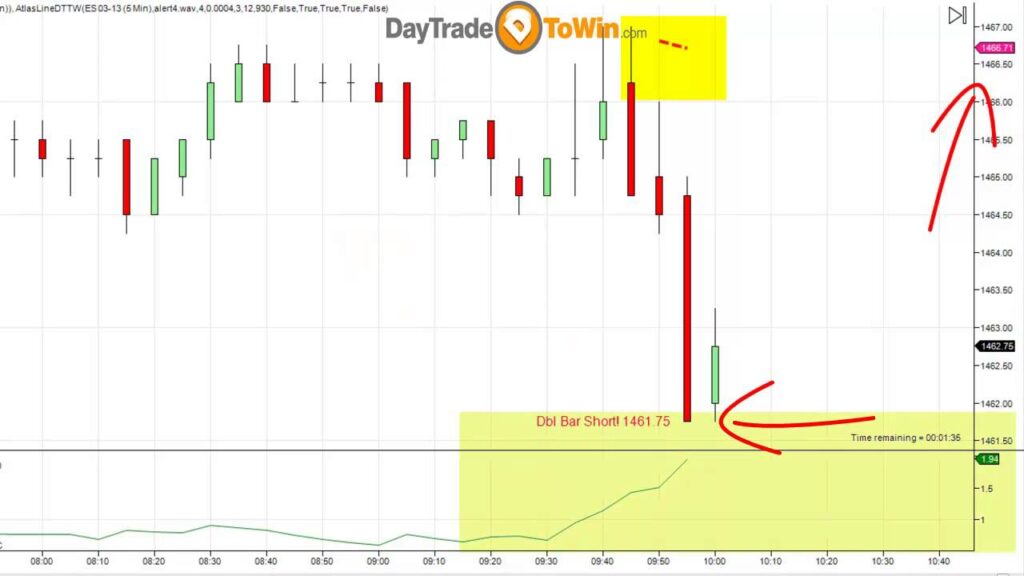
Ever see a candle suddenly plot that is much longer than the others? Of course you have – and a loss may have resulted. These candles often indicate the market is exhausted. After a candle of exhausion, you’ll probably see retracement or “confused” movement. As you can imagine, such market behavior pokes holes into many […]
Stop Losses, Profit Targets and Live Charts
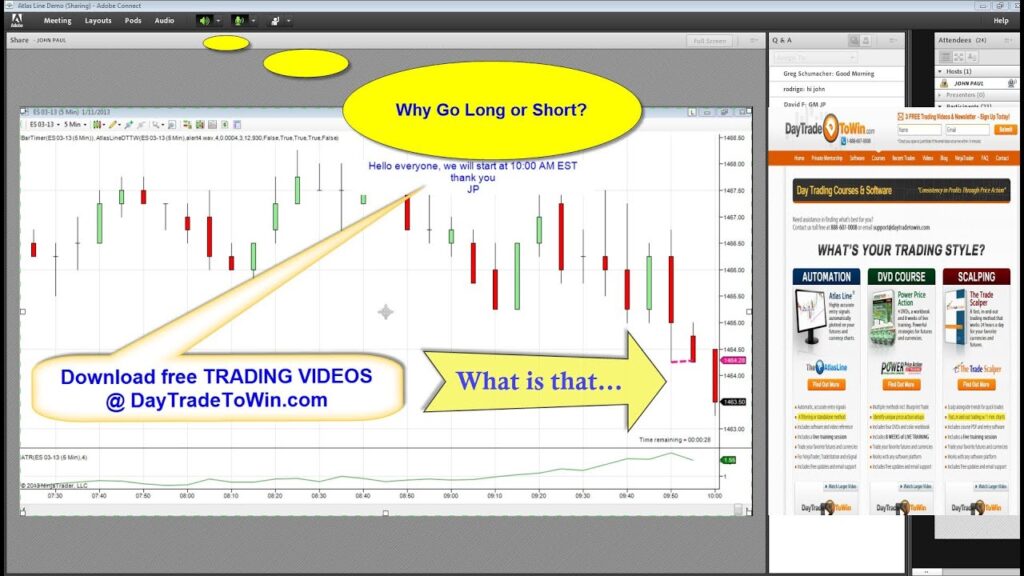
Recorded last week, John Paul pulls up his charts, shows off the Atlas Line and provides valuable information to beginner traders. Here’s a list of the highlights: – 2:00 – Why most indicators will not be helpful to your trading – 6:00 – Three stop strategies we like to use – 23:00 – Best markets […]
Atlas Line Results – 4 Months Worth
The last time we calculated our Atlas Line monthly results was back in August 2012. Let’s take a look at September through December, 2012. Remember, past performance is not indicative of future results. There is substantial risk of loss in day trading. Data used is from the Recent Trades page. Calculations were performed manually – […]
Atlas Line Live Webinar from Dec. 21, 2012
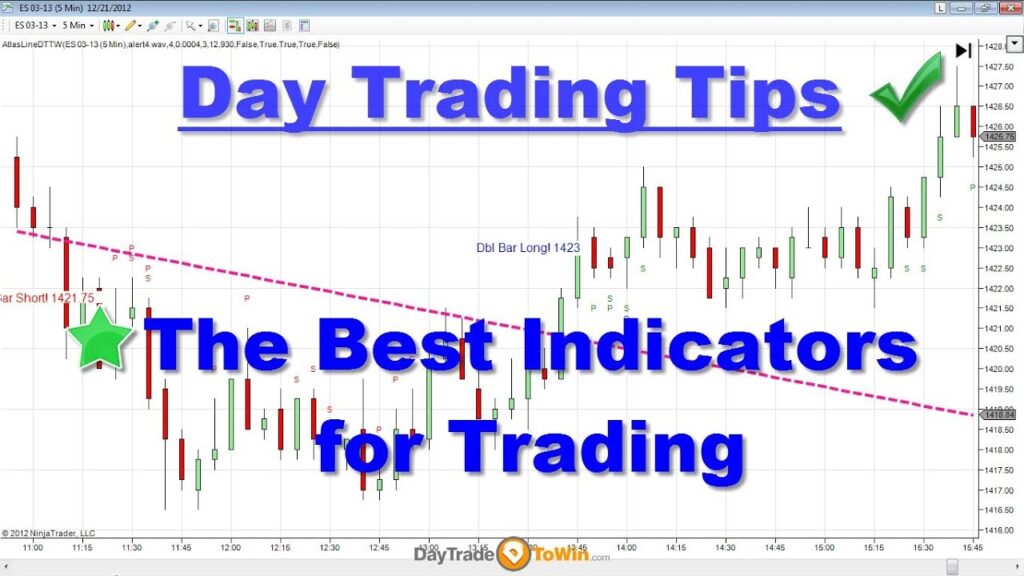
Here is the long-awaited webinar presentation from last Friday (December 21, 2012). John Paul demonstrates the Atlas Line live across a variety of charts, explaining how this indicator can be used to identify trends. By knowing the direction of the market in advance, you can position trades long or short ahead of time. Entry prices […]
The January Effect – Was John Paul’s Crystal Ball Correct?
Back in January of 2012, John used the “January Effect” to predict where the major indices will be by the end of the year, either up or down compared to where they were at the start: “…the last day of trading in January 2012 closed higher as compared to the opening price on January 3, […]
Learn to Trade with Yo-Yo Bars

In this webinar presentation, see why it’s better to trade with a clean chart and reliable strategies. The Atlas Line is software that provides entry signals for your charting platform (NinjaTrader, TradeStation or eSignal). The plotted line provides an indication of where you should be trading; either long or short. With the three stop strategies, […]