A key U.S. index continues to hold above its 20-day moving average, signaling ongoing market strength.
Japan takes center stage Wednesday after striking a tentative trade deal with the U.S., even as uncertainty lingers over whether its prime minister will bid “sayonara.”
The tariff developments have added to bullish sentiment ahead of the soft Aug. 1 tariff deadline — one that even President Donald Trump and Treasury Secretary Scott Bessent admit isn’t set in stone.
Ryan Detrick, chief market strategist at Carson Group, highlighted a striking statistic: The S&P 500 (SPX) closed above its 20-day moving average for 60 consecutive sessions as of Monday.
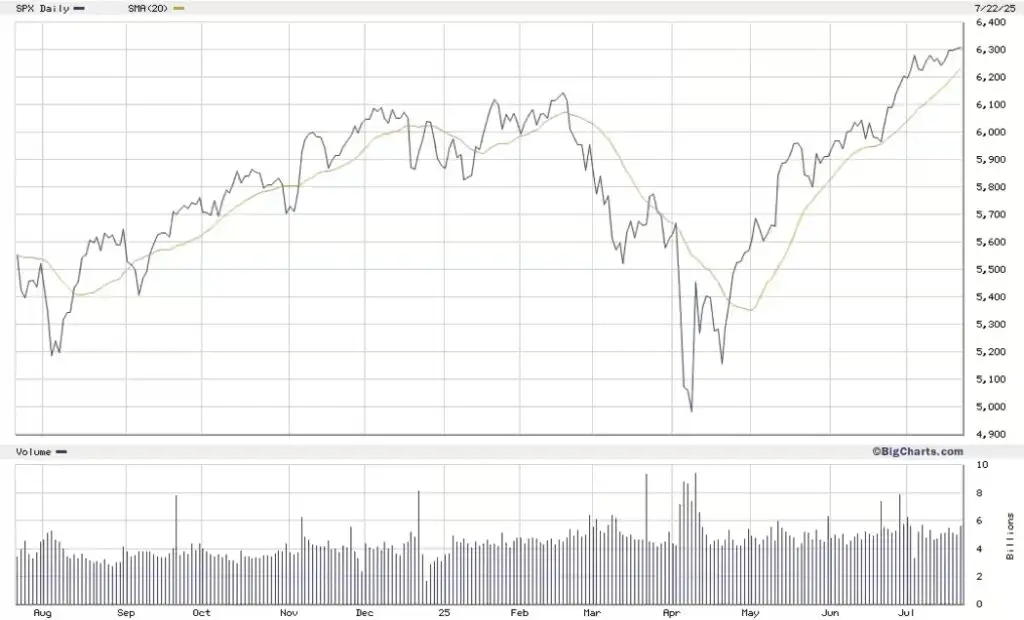
Apart from a near-miss on June 20, the streak has remained intact. Over the past 50 years, such a run has occurred only four times since 1950. Historically, the average gain a year after these streaks ranged between 20% and 26%, according to Detrick.
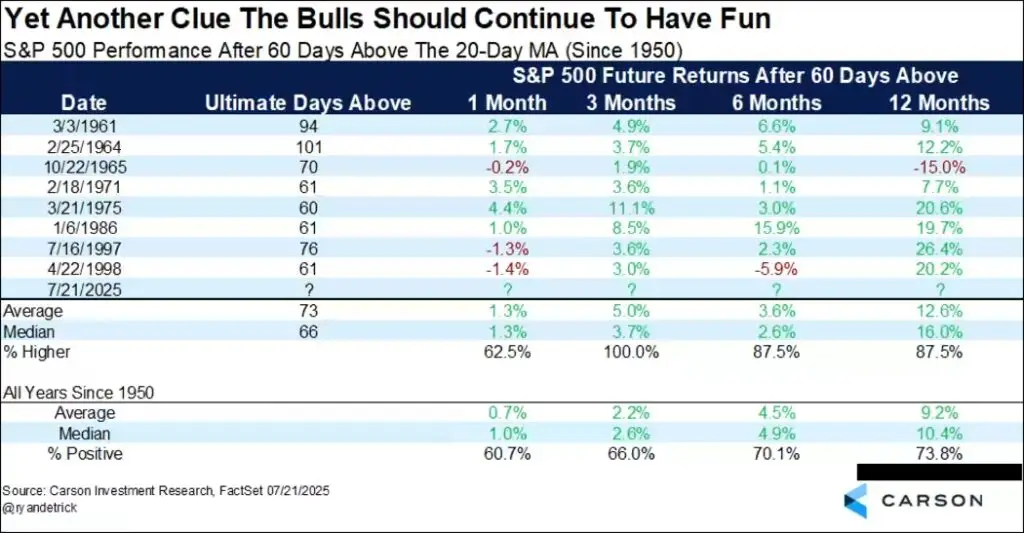
His analysis also shows that there have been eight similar streaks overall, though this is the first occurrence in the 21st century. In one outlier case from 1965, the market was lower a year later, but the median and average gains following such streaks were 10.4% and 9.2%, respectively.
“This is yet another clue that this bull market has legs,” Detrick said.
Skeptics argue, however, that the prolonged streak may signal market over-exuberance, a concern also echoed by technicians tracking similar patterns in the Nasdaq-100.
