The U.S. stock market today is nearing the extreme overvaluation levels seen at the peak on January 3, 2022.
When it rebounds from a correction and approaches a new all-time high, it’s crucial to compare current valuations with previous peaks. Investors often hope that such downturns have corrected prior excesses, setting the stage for a sustainable new bull market.
However, this isn’t the case with the S&P 500 (SPX) today, as shown in the chart below. It illustrates where various valuation indicators stand relative to their monthly distributions since 2000. A 100% reading indicates a highly bearish scenario, while 0% would represent the most bullish.
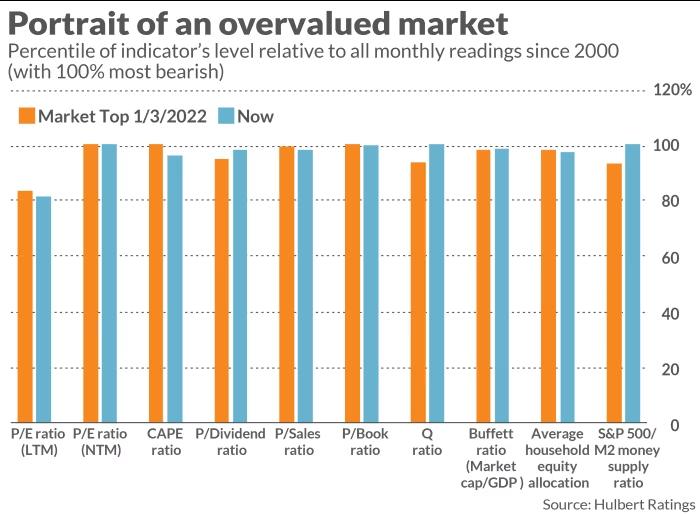
Notably, many of these indicators are currently near the bearish end of the spectrum, close to—or even surpassing—the levels seen at the January 2022 peak.
This doesn’t mean the stock market won’t continue to climb, but if it does, it will be moving into even more precarious territory than before the 2022 bear market.
Overvaluation alone doesn’t immediately spell doom for the market, as valuations have limited predictive power over short-term horizons. However, the indicators in the chart have a strong track record for forecasting returns over the next decade. As reported last month, they predict sub-inflation returns through 2034.
How today’s valuations compare to the past.
The chart’s percentiles are based on monthly returns since 2000, focusing on this period as some analysts argue that older data is less relevant. Even if we accept this view, the stock market remains highly overvalued.
Expanding the timeframe to include data since 1970 or 1950 reveals an even more overvalued market.
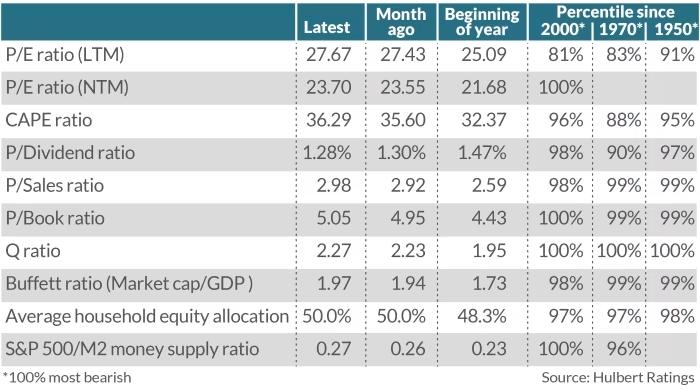
No matter how you look at it, the stock market is dangerously overvalued.

John Paul is the founder of DayTradeToWin, a trading education and software platform established in 2008 with thousands of members worldwide. He specializes in price action-based futures trading strategies and structured market analysis.
DayTradeToWin provides trading education, indicators, and software tools designed to help traders apply disciplined, rule-based price action decision-making across global futures markets.
John Paul is the creator of several trading methodologies, including the Sonic System, Atlas Line, and Trade Scalper, used by traders to identify structured opportunities in markets such as the E-mini S&P 500 (ES), Nasdaq (NQ), crude oil (CL), and gold (GC).
Official website: https://daytradetowin.com