What is the E-mini S&P 500?
DayTradeToWin focuses on the E-mini S&P 500, often abbreviated as simply “E-mini”, is a “child” or derivative of the big S&P 500 Index (Standard and Poor’s 500). You may have noticed that “S&P 500” is contained within “E-mini S&P 500”.
Wikipedia defines the E-mini S&P 500 as follows:
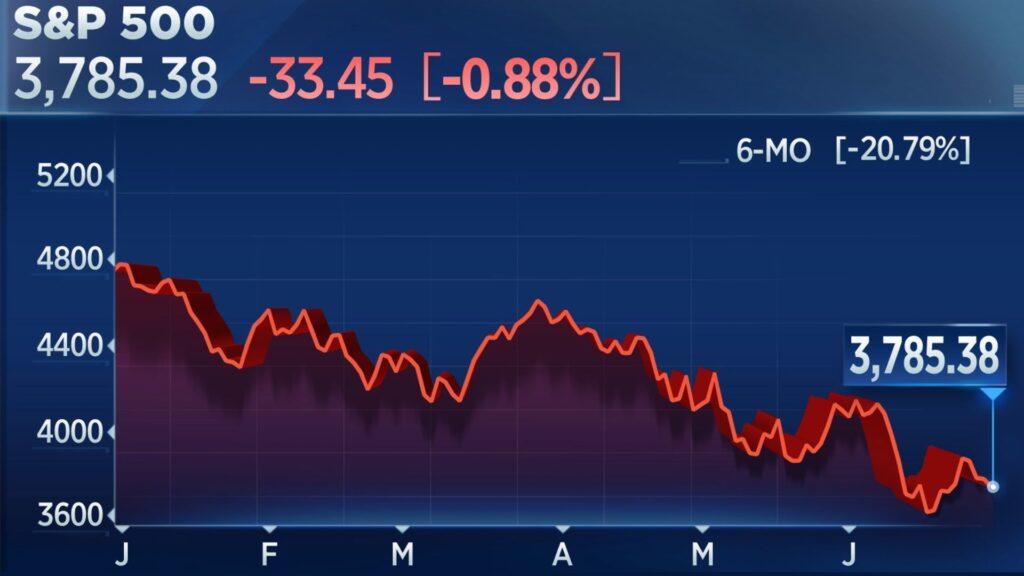
The Standard and Poor’s 500, or simply the S&P 500, is a stock market index tracking the stock performance of 500 large companies listed on exchanges in the United States. It is one of the most commonly followed equity indices. As of December 31, 2020, more than $5.4 trillion was invested in assets tied to the performance of the index.
https://en.wikipedia.org/wiki/S%26P_500
The S&P 500 is a broad, capitalization-weighted index of 500 large U.S. companies, said to represent approximately 80% of the U.S. economy, and is therefore considered a to be a key indicator of the stock market’s health. Often times, the S&P 500 is seen in mainstream news broadcasts, in ticker form, as one measure of overall U.S. economic performance.
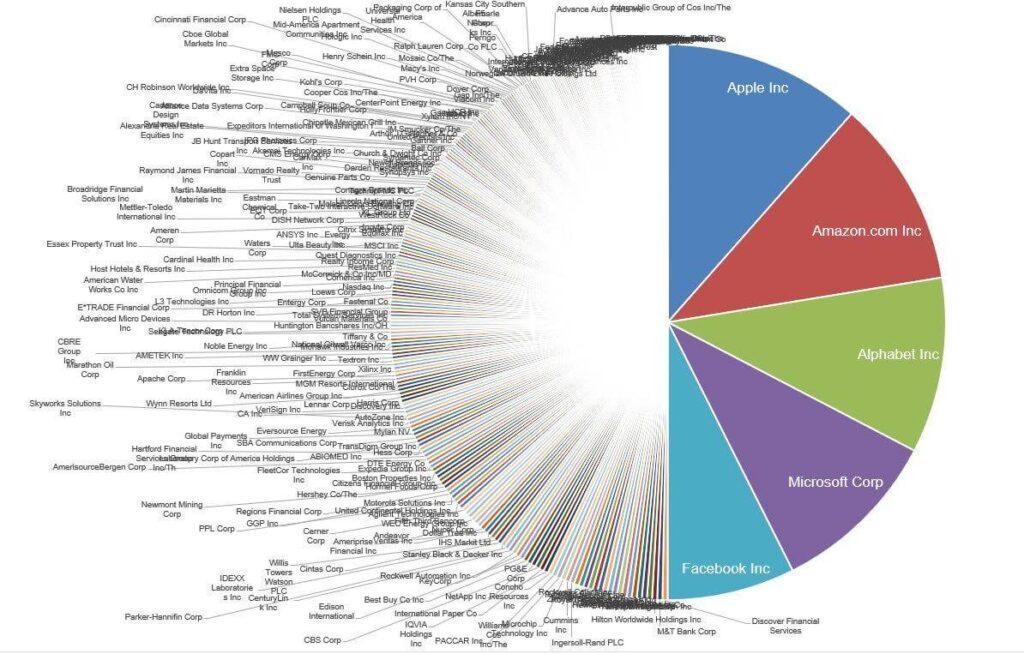
The composition of the S&P 500 is subject to change. Companies can be added and removed. A table of all 500 S&P companies is available here along with a separate table showing the “selected changes to the list of S&P 500 components.” The latter table is introduced with:
S&P Dow Jones Indices updates the components of the S&P 500 periodically, typically in response to acquisitions, or to keep the index up to date as various companies grow or shrink in value.
https://en.wikipedia.org/wiki/List_of_S%26P_500_companies
Regarding the valuation of the S&P 500 and its https://daytradetowin.com/trading-tips-for-successsubstantive importance for human life, a large side discussion can be had about what it means to measure the health and wealth of a nation and its people by the valuation of 500 large corporations. That is for another time, perhaps!
The E-mini provides a “minified” or more affordable way to trade the S&P 500 Index. The E-mini is traded via futures contracts. A futures contract can be defined as follows:
A futures contract is a legal agreement to buy or sell a particular commodity asset, or security at a predetermined price at a specified time in the future. Futures contracts are standardized for quality and quantity to facilitate trading on a futures exchange.
https://www.investopedia.com/terms/f/futurescontract.asp
E-mini reference:
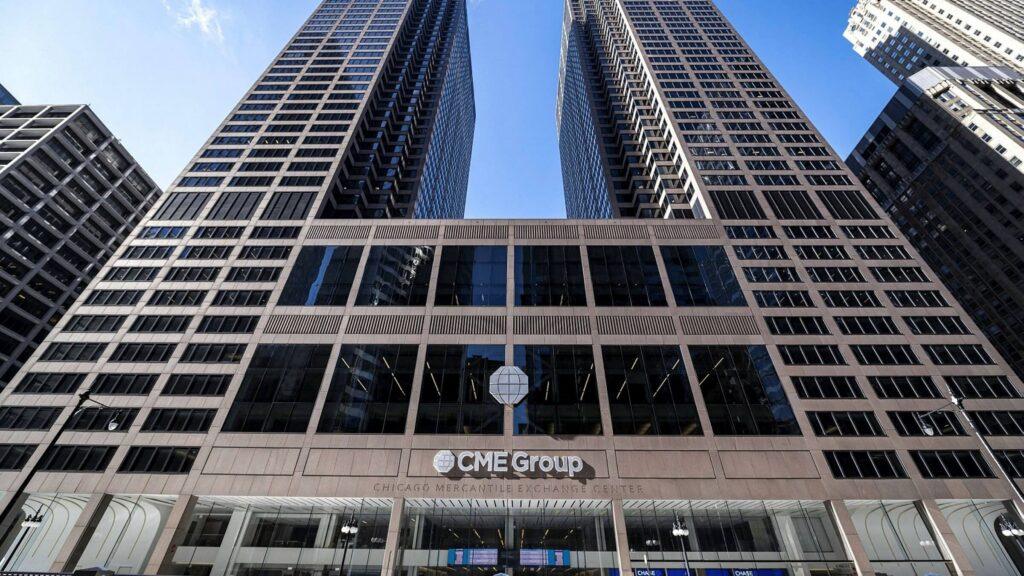
- Exchange: CME Group
- Classification: U.S. equity index future
- Ticker symbol: ES
- More information (quotes, margins, specs, etc.): https://www.cmegroup.com/markets/equities/sp/e-mini-sandp500.html
How is the E-mini S&P 500 traded?
Generally, the goal of financial trading is to maximize profit and minimize risk.
Trading is appealing for many reasons. One such reason is the potential to make significant money while avoiding the rigors of common occupations.
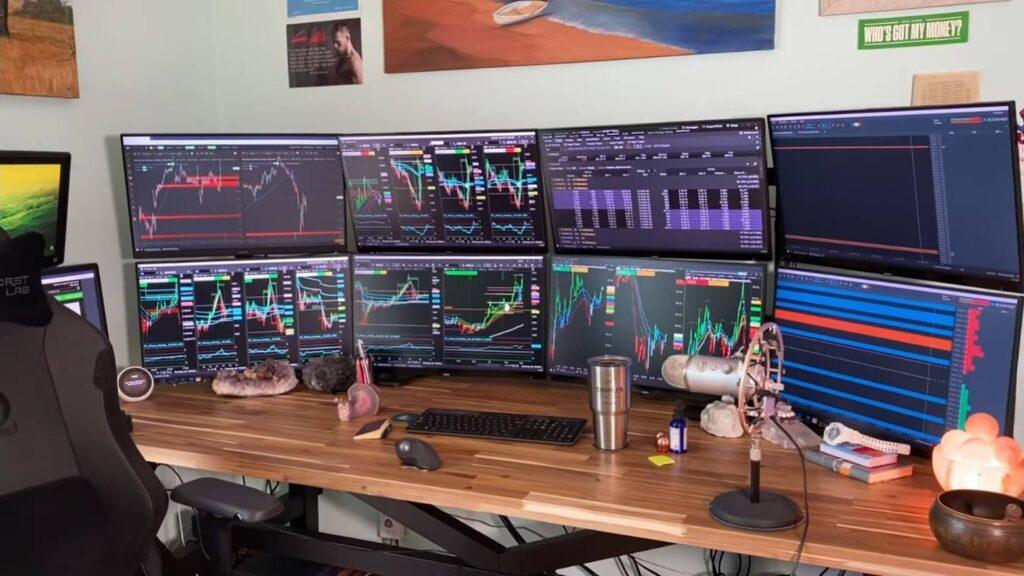
A person may trade (buy and sell) E-mini (ES) futures from a modern, personal computer. Such a person may be referred to as a “retail trader” or “individual trader”, trading using a personal account. A retail trader may place trades at home or other locations where a decent internet connection is available.
Two other types of traders exist:
- Institutional traders: those whom trade for organizations, such as banks or companies.
- Trading algorithm: software that makes decisions and places trades according to its programming, often doing so much faster than an individual
All three types of traders tend to employ one or more methodologies, as random placement of trades is unlikely to yield long-term success. A retail or institutional may use a trading algorithm, trading software, or many tools in seeking desirable results.
The pursuit of individualized or group financial gain gives rise to popular trading software as well as proprietary methodologies (i.e., somewhat secretive trading techniques). Over the years, many companies have sprung up, offering educational trading services, downloadable tools, and various financial arrangements, such as prop firms. U.S. financial regulators such as the CFTC (Commodity Futures Trading Commission) encourage discernment of such offerings.
Trading software, such as NinjaTrader 8, allows a trader to see charts and other financial data moving in real-time. In combination with such software, a trader may use various types of tools, analysis, automated systems, and techniques to engage in or avoid trading.
Because the E-mini is a futures contract, a trader can decide how many contracts should be used per trade. In NinjaTrader, the desired number of contracts to be used per trade is specified under the “quantity” label. In this way, the contract amount acts as a multiplier for potential profit or loss.
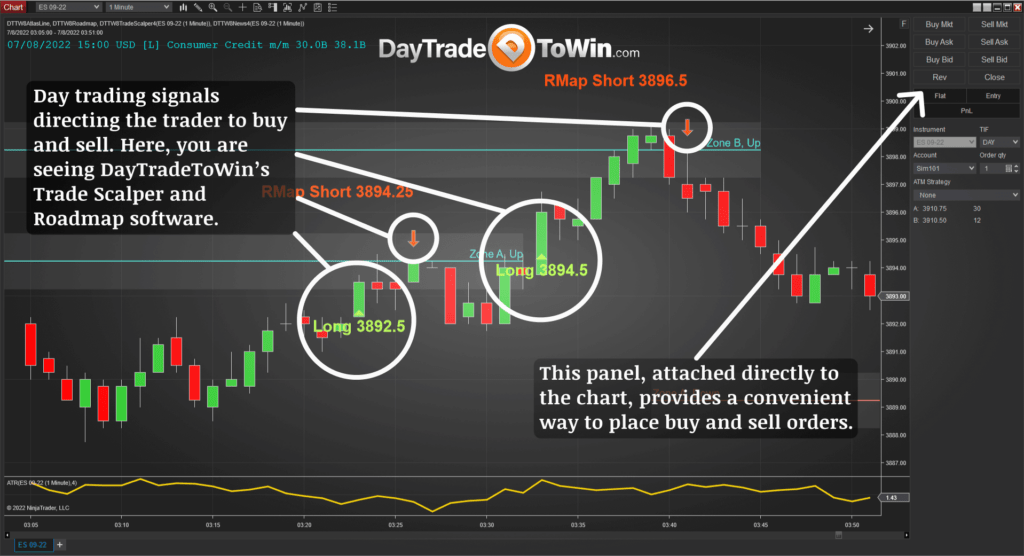
For E-mini charts, the smallest movement of price, up or down, is called a “tick”. The E-mini is valued at $12.50 per tick. In common trading terminology, one point is defined as four ticks. Therefore, one point of the E-mini is worth $50 ($12.50 per tick * 4 ticks = $50, one point). Before any commissions or fees, one point of E-mini profit at $50 is actually $100 if two futures contracts are used. Again, the contract amount acts as a multiplier for potential profit or loss.
A trading broker acts as a sort of gateway or middle-entity between the exchange and the trader’s account that is established with the broker. Typically, such a futures broker is compensated via a commission that is applied per contract, per trade. Rates differ among brokers and other fees and requirements may be applicable. For more information, see NinjaTrader Brokerage and other licensed, reputable brokers and financial specialists.
Some markets, or instruments as they are sometimes called, can be traded almost around the clock. The E-mini contract trades from Sunday to Friday 6:00 p.m. – 5:00 p.m. (New York Time/ET) with a 15-minute trading halt from 4:15 p.m. to 4:30 p.m. ET. From 5:00 p.m. to 6:00 p.m. ET, a daily maintenance period occurs. Some hours of the day are more preferable for trading than others.
The “when” and “how” of trading all depends on the perspectives, capital, understandings, and methodologies employed by the trader.
How the E-mini S&P 500 Came to Be
So, why would the E-mini S&P 500, a child or smaller version of the S&P 500, need to exist? Let’s go back in time to find out…

For 15 years, from 1982 to 1997, the U.S. stock market experienced long-term bull market (upward) conditions. Do you remember those years? By 1997, the S&P 500 surpassed the 1,000 level and was now valued beyond the financial reach of many traders. In other words, the E-mini S&P 500 was launched in 1997 due to the significant capital that would now be needed to trade the S&P 500 above the 1,000 level.
CME Group, today’s exchange for the E-mini S&P 500, explains the history and math like so:
At that time, the multiplier for the standard pit-traded S&P 500 futures was 500, meaning the contract notional value exceeded $500,000. The performance bond margin requirement exceeded $25,000 and was therefore beyond the reach of most traders. As a result, CME decided to launch a smaller, bite- sized, more retail-friendly version of the S&P 500: the E-mini S&P 500.
https://www.cmegroup.com/education/articles-and-reports/the-origins-of-the-e-mini-sp-500.html
To understand the value of the E-mini as connected with the S&P 500:
The notional value of one contract is 50 times the value of the S&P 500 stock index; thus, for example, on June 20, 2018, the S&P 500 cash index closed at 2,767.32, making each E-mini contract a $138,366 bet.
https://en.wikipedia.org/wiki/E-mini_S%26P
Hopefully, you can now see how the E-mini S&P 500 is a “minified”, less costly version of the big S&P 500.
Back in 1997, this affordability attracted many traders. The E-mini, as it is often called, was an instant success. At that time, worldwide electronic training was in full swing. The E-mini was exclusively offered via the CME Globex exchange.
E-mini growth metrics:
- September 9, 1997 (at launch): 7,000 contracts traded per day
- By the year 2000: 80,000 contracts traded per day
- By the year 2018: 2,000,000 contracts traded per day
These days, the E-mini consists of more dollar volume than all 7,600+ worldwide ETFs. As of 2020, those ETFs represented 7.74 trillion U.S. dollars in assets. In comparison, in 2020, the E-mini represented
In May of 2019, CME Group introduced Micro E-mini futures. The reason for this launch was much the same as the reasoning for the E-mini to emerge from the S&P 500: increase access and tradability. Accordingly, the Micro E-mini (MES) is valued at 1/10th the regular E-mini: $1.25 per tick as compared to $12.50 per tick for the regular E-mini (ES). Further details are available here.
Over the years, the E-mini has seen a number of shakeups, and like other financial instruments, the E-mini subject to various forms of manipulation or exploitation.
For example, regarding the 2008 financial crisis:
Since the 2008 financial crisis, US monetary policy and the Federal Reserve Bank have played a dominant role in supporting the economy. Owing to the loose monetary policy, stock index futures were able to sense the beginning of a recovery well in advance of the actual one in 2009. Three rounds of quantitative easing totaling more than 3 trillion dollars has helped the S&P 500 rally 194% off of its spring 2009 low to its recent new all-time highs in June 2014.
https://www.cmegroup.com/education/whitepapers/e-mini-sps-the-ultimate-index.html
How one trader allegedly caused the 2010 Flash Crash:
“How a gamer caused a trillion-dollar stock market crash” He [Navinder Sarao] began engaging in what is known as “spoofing.” He hired software developers to write programs that would allow him to place millions of dollars worth of orders, then—after other traders had reacted to his potential trade—abruptly cancel his order.
https://nypost.com/2020/06/27/how-a-gamer-caused-a-trillion-dollar-stock-market-crash/
Regarding high-frequency trading and dark pools:
This Article argues that gaps in governance, contentious conflicts of interest, and increasingly intense fragmentation in trading markets create a growing source of underexplored concerns. An examination of the current regulatory framework reveals noteworthy perils including the potential for high volatility and significant market disruption. These concerns necessitate exploring ex ante the various enforcement measures, regulations, governance protocols, and information gathering tools already employed in markets to mitigate systemic risk concerns. This Article cautions regulators and commentators to emphasize dynamic, sustainable macroprudential regulatory solutions.
https://jcl.law.uiowa.edu/sites/jcl.law.uiowa.edu/files/2021-08/Johnson_Final_Web.pdf
The E-mini S&P 500 and the COVID-19 Pandemic
Using the NinjaTrader 8 trading platform, an E-mini S&P 500 weekly chart can be produced as follows. The chart spans from January 2020 through early July 2022.
As the saying goes, a picture says 1,000 words…
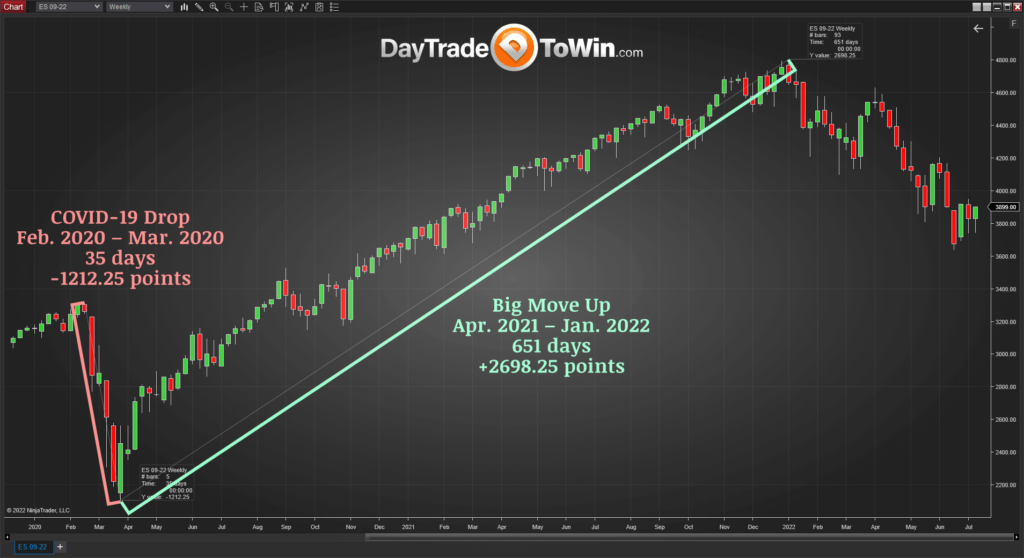
Price consistently falls from February through March of 2020, in line with public uncertainty of an emerging, unprecedented global pandemic, or at least the news of one, depending on perceptions. This drop represents -1212.25 points over 35 days.
From April 2021 through early January of 2022, the price steadily rises for approximately 651 days, reaching the highest high ever recorded and representing a cumulative climb of 2698.25 points.
During the 651-day period, was there news of mass death, shortages, chaos, and other suggestions of doom and gloom? Yes. Did the markets continue to rise regardless? Yes.
You may make your own conclusions as to why this is so. Perhaps worth noting the E-mini consists of “big pharma”–Pfizer, Johnson & Johnson, Merck & Co., and other well-known companies.
In fact, Standard and Poor’s provides industry indices for trading a particular type of industry such as big pharma:
S&P Select Industry Indices are designed to measure the performance of narrow GICS® sub-industries. The Index comprises stocks in the S&P Total Market Index that are classified in the GICS pharmaceuticals sub-industry.
https://www.spglobal.com/spdji/en/indices/equity/sp-pharmaceuticals-select-industry-index/#overview
For example, SPSIPH is the ticker symbol for the tradable S&P Pharmaceuticals Select Industry Index.
Again, the S&P 500 is broader in scope than the Dow and NASDAQ 100 because the S&P 500 spans many industries, including big pharma, weapons/aerospace/defense (Lockheed Martin, Northrop Grumman, etc.), the food industry (General Mills, Kellogg’s, Sysco, Tyson, etc.) big tech (Apple Inc., Comcast, etc.), energy, minerals/resources, real estate, construction, household products, restaurants, and others. See the list of S&P 500 companies here.
Corporations tend to perpetually seek growth, power, influence, and profit, often times monopolizing or creating mutually beneficial agreements among themselves.
If the pandemic and its effects are lessening, why does the E-mini appear to be falling since January 2022? Many explanations can be provided. How much is the E-mini a reflection of U.S. stock performance? How much of it is an abstraction? How much of the E-mini’s activity is a result of the instrument having a “life of its own”, so to speak?
The DayTradeToWin Approach to Trading
At DayTradeToWin, we value our lives as human beings, our families, and friends, as the priority.
Money is a means to assist others and provides for certain types of meaningful experiences.
That said, our approach to trading has always been about reducing the amount of time it takes to find financial success. That way, you can focus your life in other ways; what you enjoy and find meaningful.
It is easy to get lost in headlines, theories, financial analysis, opinions, and temptations, and distractions. Again, our style of trading reflects an understanding of this.
We trade using price action. This means focusing only on what occurs in the chart in front of you. There is no need to create complexity.
After all, it is price movement that determines profit and loss. Price movement, or price action, is therefore most important, period.
That is why we use price movement to guide our trading. We let price dictate if we should trade and how we trade. This informs us of whether a trade is present, if it is potentially worth taking, where the entry point should be, what the profit target should be, what the stop loss should be, and how to manage the trade.
Furthermore, such an approach, emphasizing simplifying and objectivity, reduces stress, emotional triggers, and eliminates guesswork.
If this resonates with you, feel free to review our day trading courses and software, here.


