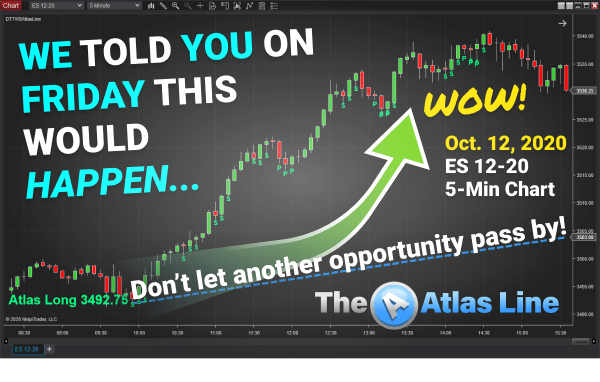
Update: Today, Oct. 12, 2020, we had a big up today. Wow! Yes…just as John Paul said we would in the live webinar that occurred on Friday, Oct. 9, 2020. So, did you buy the market and hold on?
Also, the Atlas Line® chart below confirms the up move. Yes, you can combine the Atlas Line® with these January Effect retracements to identify intraday opportunities! Only so many opportunities like this remain for 2020…

>> Get the Atlas Line® signals today <<
Feel free to read on as the remaining portion of this post is untouched and as we wrote it on Friday, Oct. 9, 2020…
—
Today, John Paul conducted a live webinar where he shared predictions, big upcoming opportunities for swing trading, and of course, signals across a variety of instruments and charts.
The following video is a segment of the webinar that discusses the January Effect only. Why is this important? We are in the final months of 2020. Now, we expect to see the January Effect in action more than ever.
Learn More Trading Strategies Here
In case you’re not familiar with the January Effect, the basic idea is as follows. If you take the starting price of the E-mini on Jan. 2, 2020 (the first day the market was open) and then on the final trading day of the same month (Jan. 30, 2020), if price was higher closing the month than opening the month (an “up month”), the year will be an “up year.” This means that December 2020 will close higher than the year opened in January 2020. Using this January Effect strategy, you can look for long (buying) opportunities at key points throughout the year. This explanation begins at approximately 4:00 in the video above.
In early February of this year, there was a buying opportunity that would have been successful. Then by February 20 or so, we saw the market hit a peak and there was a dive. By June, we saw the market recover. Keep in mind, the halfway (50%) point in the upward climb is the point to watch for. If you have the previous high and an established low (after some time of course) with what looks like a recovery on a daily chart, then use the Fib tool configured with three values (0%, 50%, and 100%) to easily identify the halfway (50%) point and wait until it’s surpassed with closing bars. Then look for your entry. Another winning example is provided using early August.
At this present moment, we have what appears to be a prior high, a bearish trend, and upward movement! Price has just surpassed the 50% level. Conditions look ideal for buying. Again, we expect this year to be an “up year” overall, so we have more confidence in this type of trading. Keep in mind, we’re talking about buying the market and holding it for multiple days. This type of trading is different than the typical intraday trading related to our signal systems.
So, will you be buying the market/going long now?
If you want to have a pro trader teach you how to trade, now is the time to enroll in our eight-week Mentorship Program. The next Group class begins Oct. 15, 2020. There are only so many big opportunities left in 2020…


