Dispelling the Notions: Understanding the True Nature of the Vix’s Low Levels
Following a brief stock-market selloff last month, the subsequent drop in Wall Street “fear gauge,” the Cboe Volatility Index (VIX), has sparked discussions about its reliability.
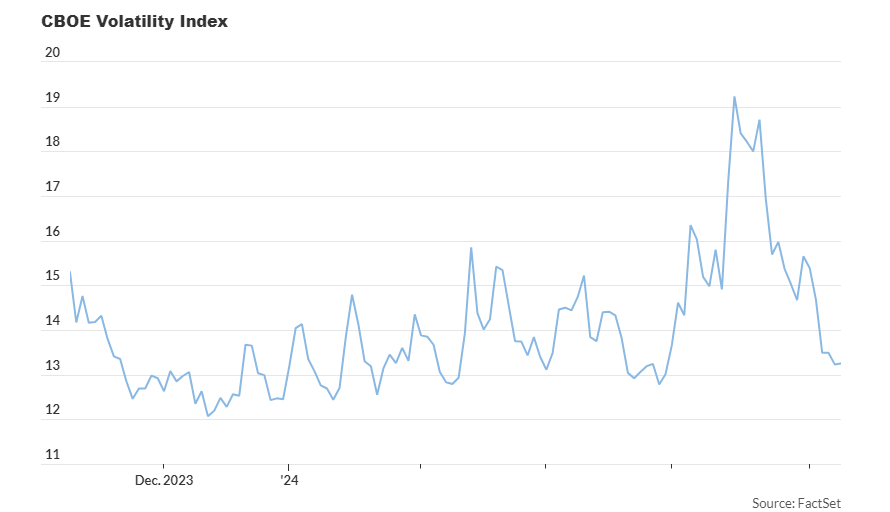
Some attribute its decline to factors like the growing popularity of zero-days-to-expiry (ODTE) options or the rise of ETFs. However, Nicholas Colas from DataTrek suggests a simpler explanation: the VIX is reflecting the current calmness in the stock market.
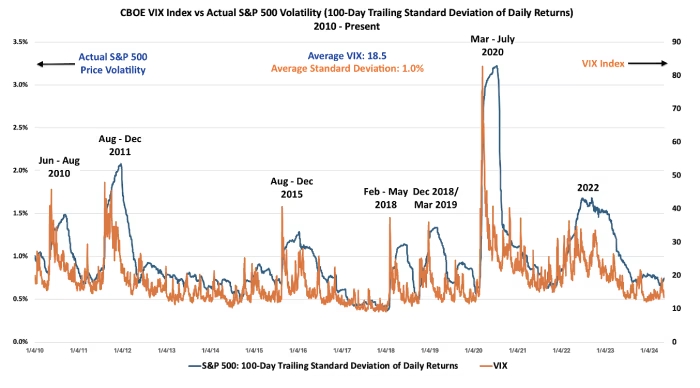
Colas highlights that the VIX is trading in line with the subdued volatility observed over the past 100 trading sessions. With the S&P 500 showing lower-than-average daily returns, it’s unsurprising that the VIX is down as well.
Contrary to misconceptions, the VIX doesn’t anticipate future market risks but rather reflects recent market behavior. It primarily considers trading activity in one-month S&P 500 index options. Despite criticisms regarding various potential risks facing stocks, the VIX’s level remains rooted in recent market trends.
Despite hitting its lowest level since late March, another indicator, the Cboe VVIX, reflecting demand for options tied to the VIX, has also fallen notably. This indicates a broader market sentiment of reduced fear and risk aversion.
While U.S. stocks traded mixed on Wednesday, with the S&P 500 and Nasdaq slightly down while the Dow Jones slightly up, the underlying message is clear: the VIX reflects the market’s recent calmness, despite ongoing uncertainties.

