While U.S. stocks might witness a brief respite in the coming week, experts are cautioning against interpreting it as the end of the ongoing late-summer selloff.
Analysts suggest that any rebound anticipated would likely serve as a momentary relief before the S&P 500 SPX resumes its descent towards the critical support level of 4,200, as indicated by technical analysts.
Several technical strategists have shared research notes with MarketWatch, highlighting that multiple indicators suggest that the S&P 500 and Nasdaq-100 have entered “oversold” territory.

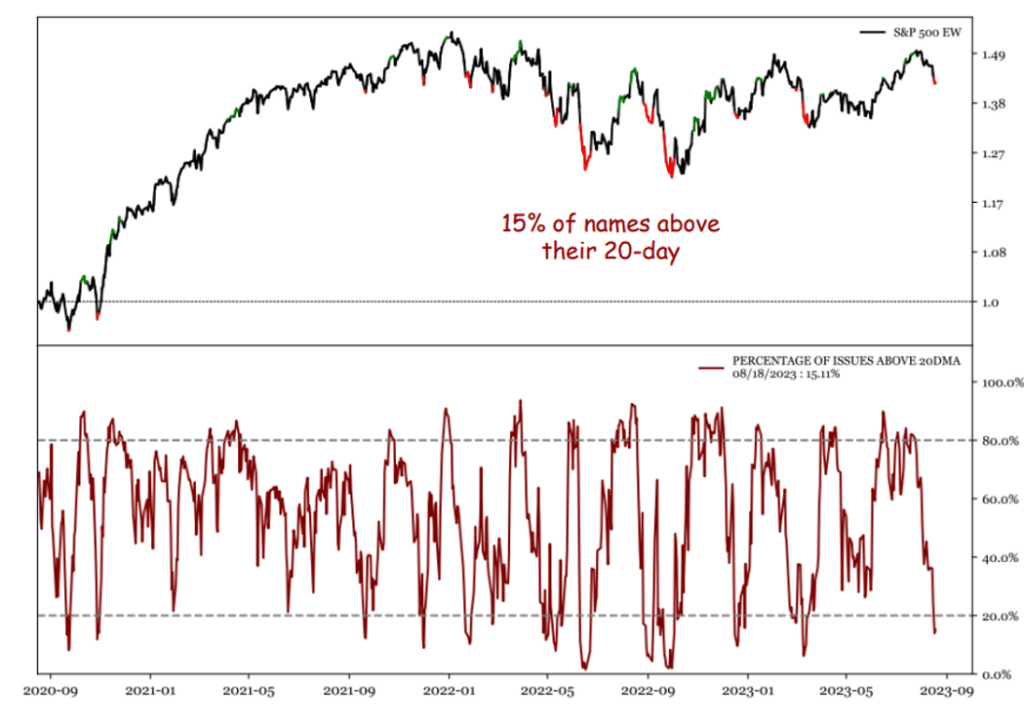
For instance, recent data shows that only 15% of S&P 500 stocks were trading above their 20-day moving average, a metric pointed out by experts like Jonathan Krinsky of BTIG and Jeffrey deGraaf from Renaissance Macro. Refer to the chart below provided by deGraaf and his team:
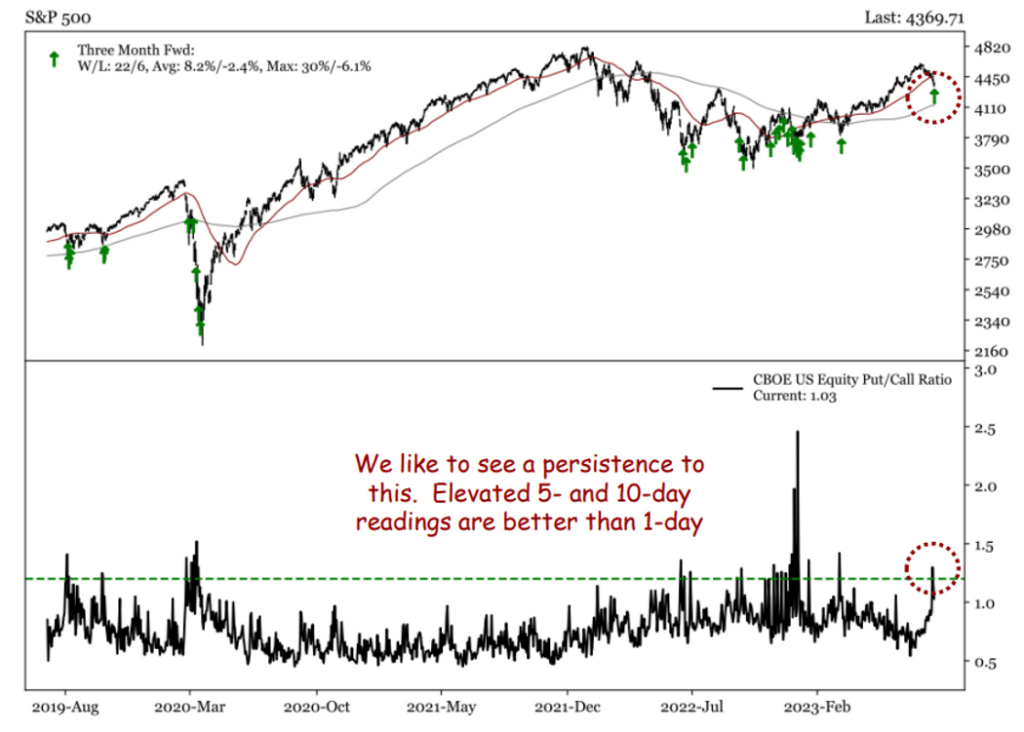
Both Krinsky and deGraaf referred to the 10-day U.S. equity put-call ratio, which has spiked to its highest level in 2023. This surge indicates an increased preference for put options, which tend to yield returns when stock prices decline.

Nevertheless, Krinsky advised his clients to maintain focus on the bigger picture, suggesting that the ongoing selloff might only be halfway through its course.
Krinsky anticipated that any bounce should lose momentum around the 4,450 mark, while technical experts are eying 4,200 on the S&P 500 as a robust long-term support level. It’s worth recalling that 4,200 had been a significant resistance level for stocks over six months.
“While there are reasons to expect some near-term relief, we think the selloff is only about halfway done,” Krinsky commented.
Other market observers share a similar perspective, including Katie Stockton, the founder and managing partner of Fairlead Strategies. She predicts that the S&P 500 will likely stabilize just below 4,200, potentially erasing most of the year-to-date gains. FactSet data indicates that the S&P 500 had risen nearly 20% for the year at its peak last month.
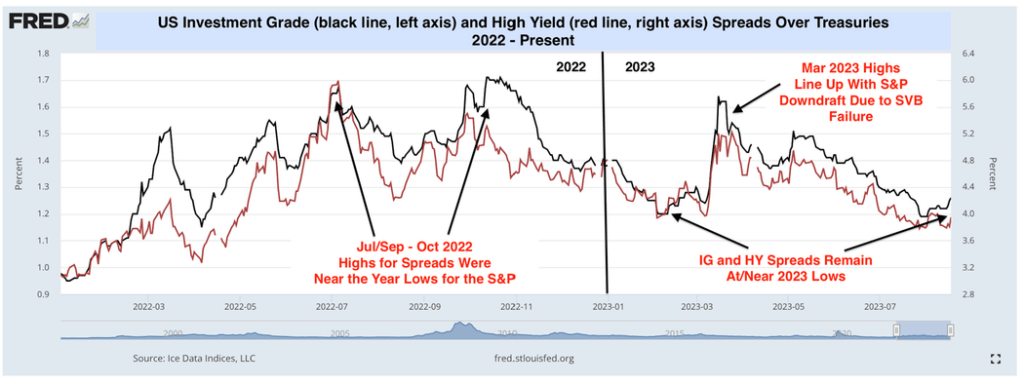
Another intriguing development is the modest spread between Treasury yields and corporate bond yields. This distinctive characteristic sets apart the current selloff from previous instances when stocks plummeted to their yearly lows, such as in October. Nick Colas from DataTrek noted in a recent research note that the spreads for corporate bonds, at 1.26 percentage points over Treasurys for investment-grade corporates and 3.95 points for high-yield bonds, remain “remarkably low.”
This suggests that investors are potentially reevaluating equity valuations that many consider overextended, given their expectations for corporate earnings.
As of late July, the forward 12-month price-to-earnings ratio for the S&P 500 stood at 19.4, surpassing the five-year average of 18.6 and the 10-year average of 17.4, as per FactSet data. The index’s recent decline has brought it to a more manageable level of 18.6, in line with its five-year average.
“The disparity this month must come down to something that is unique to stocks, and that is equity valuations,” noted Colas.

While investors keep a watchful eye on corporate bond spreads, concerns rise in tandem with long-dated Treasury yields. Any indication of their upward movement could signal the onset of bond investors’ apprehensions about increased borrowing costs impacting corporate cash flows and profits.
Despite these uncertainties, U.S. stocks concluded Monday with mostly positive results. The Nasdaq Composite COMP snapped a four-day losing streak, surging by 1.6% to 13,497.59 points. The S&P 500 registered a 0.7% increase to 4,399.77 points. On the other hand, the Dow Jones Industrial Average DJIA experienced a slight decline of 0.1% to 34,463.69 points. Both the S&P 500 and Nasdaq endured three consecutive weeks of decline.
The upcoming week presents an array of potential risks for stocks, including Federal Reserve Chairman Jerome Powell’s speech and an earnings report from market standout Nvidia Corp. NVDA, +8.47%.


