The Nasdaq-100, which has been the standout performer among major U.S. stock indices so far this year, has just suffered its most challenging fortnight since December, as per the data from Dow Jones Market.
On Friday, the technology-centric index concluded a two-week drawdown of 4.6% by closing 100.77 points, or 0.7%, down at 15,028. This represents the largest loss since December 23 when the index had a pullback of 5%, as shown by Dow Jones Market Data.
The recent revelation suggests that the soaring technology stocks are experiencing a decline in their typically strong market momentum. As per Wednesday’s report, for the first time since March 10, the widely followed Invesco QQQ Trust Series 1 QQQ exchange-traded-fund on the Nasdaq-100 index, finished below its 50-day moving average, as per FactSet data. The index has now consecutively ended below its moving average for three sessions, which, according to technical analysts, gives another hint that the index’s gains in 2023 might continue to wane.
About 40% of the Nasdaq-100’s value is made up of a few extremely valuable large technology stocks. The decreasing strength of several of these crucial stocks, which significantly contributed to the U.S. market’s recovery in 2023, is increasing worries that the market could be on the brink of a more significant and potentially widespread sell-off.
The stocks of four of the leading companies known as the “Magnificent Seven” – Apple Inc., Nvidia Corp., Microsoft Corp., and Tesla Inc., all ended the week under their 50-day moving averages.
Analysts suggest that indicators of an intensifying technology selloff might be hidden beneath the surface of the market.
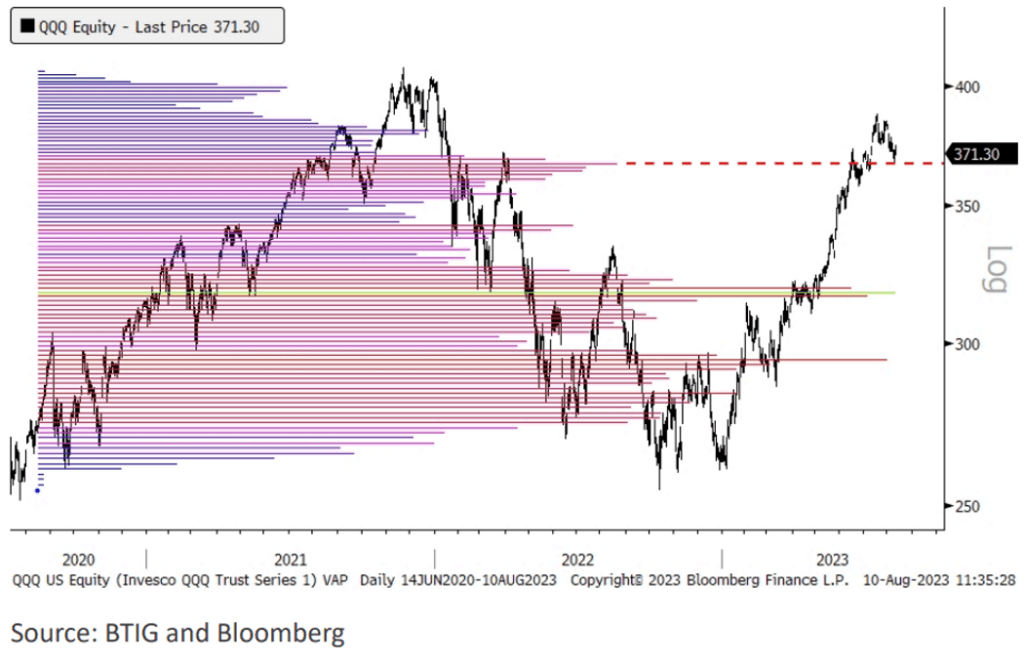
On Thursday, Jonathan Krinsky, BTIG’s leading technical analyst, distributed a research note to clients and the media suggesting that QQQ and several other tech-centric ETFs are approaching a “volume pocket.” This indicates they could potentially experience a rapid decrease in value.
An examination of volume-at-price data from the past three years reveals that a persistent drop below $368 for QQQ could expose it to a more accelerated sellout. This is based on past volume-at-price, an instrument utilized by stock analysts to identify potential points of support and resistance for a particular security.
Krinsky analyzed the trading volume of a specific security at various price levels over a specified time frame, using the volume-at-price metric. His analysis covered the previous three years.
“Krinsky mentioned in a phone conversation with MarketWatch that support and resistance mechanisms rely on the history of price values. He further added that within these boundaries, the participants don’t recall the price frames thoroughly which may lead to speedier fluctuations in prices,” Krinsky elaborated.

Krinsky pointed out that QQQ witnessed an approximately 16% surge over a six-week span from the end of April to the middle of June. Such a significant increase raises the possibility of an equally rapid reversal, if not quicker. As of Friday’s market close, QQQ has seen a 37.5% increase since the start of the year. This is corroborated by data from FactSet.
The retreat has been attributed by analysts to multiple elements such as excessive investment concentration, overly inflated appraisals for the top performing stocks, increasing treasury returns, and corporate profits that did not align with investors’ high expectations.
Increased Treasury yields have exacerbated pressure on stocks, particularly high-performing tech stocks that are highly susceptible to changes in interest rates.
The major concern at present is if Big Tech’s continued decline will drag the wider market down with it, or if other sectors of the market will step in to compensate for this shortfall.
Look here: Monday’s special rebalancing resulted in four significant alternations in the Nasdaq 100.
James St. Aubin, the primary investment director at Sierra Investment Management, mentioned that it appears traders are happy to shift their focus towards other sectors of the market, which are not as highly valued as the major technology companies.
The front runners are losing their lead, but those trailing are now catching up, said St. Aubin in a phone conversation with MarketWatch. If money was being pulled out uniformly and redirected into cash and bonds, that would be more worrisome.
U.S. stocks experienced a slight increase on Thursday, although they failed to maintain most of their initial surge. The market initially experienced a boost after July inflation data was released, fitting closely to economists’ predictions. However, Mary Daly, the San Francisco Fed President, claimed that there still lies substantial work for the Fed in controlling inflation. This led to a rise in Treasury yields, leading to a quick reversal in the equity market.
On Friday, the S&P 500 SPX closed with a downturn, witnessing a decrease of 4.78 points, or 0.1%, settling at 4,464.05. This marked its second consecutive week of decline. The Nasdaq Composite COMP, which encompasses a wider range of stocks compared to the Nasdaq-100, also saw a drop of 93.14 points or 0.7%, ending the day at 13,644.85.
The Dow Jones Industrial Average (DJIA) stood out positively, increasing by 105.25 points or by 0.3%, reaching 35,281.40.
On Friday, the 10-year Treasury yield BX:TMUBMUSD10Y surged to 4.156%, settling at its highest point in a week, according to data from Dow Jones Market.


