Atlas Line Results for June, July, and Aug. 2013
On occasion, we like to produce a monthly summary of how well the Atlas Line has performed based on the Recent Trades data. June, July, and August of this year were all successful months as indicated by the totals below. August 2013 Total # of trades = 79 Total # of days traded = 22 […]
Price Action Pullback Trades on E-mini S&P
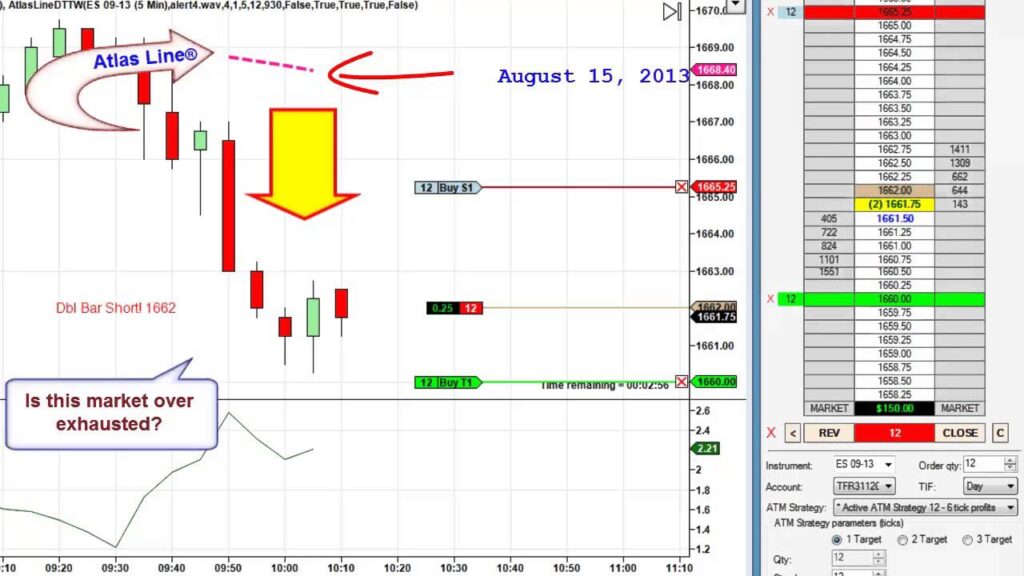
» Get the Atlas Line « In this video, John Paul shows us an Atlas Line trade and also how to deal with oversold market conditions. John Paul says that after a big move occurs, the market will pause and take a “breath.” During this recovery phase, price may chop back and forth and leave […]
Atlas Line Used with Power Price Action Blueprint Method
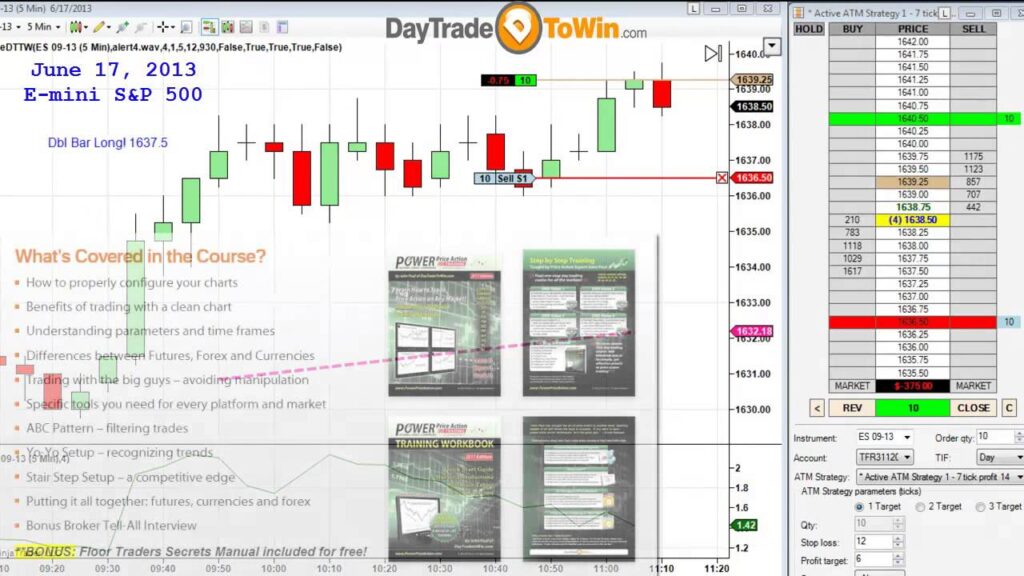
» Get the Atlas Line « When you have two separate strategies telling you to go either long or short, you feel more confident in taking the trade. In this video, John Paul shows how a technique called the Blueprint Trade (taught in the Power Price Action DVD course) coincides with a Long signal produced […]
Atlas Line Performance Shown in Equity Curve
Ron Wichgers, an Atlas Line trader and trading instructor from the Netherlands, recently shared with us his thoughts on analyzing trading system performance. Using the Atlas Line data from our recent trades page from Jan. 1, 2013 through May 31, 2013, he’s created the graph below. Based on his professional trading experience, he’s also provided […]
Live Trade Taken for 3 Points During Today’s Atlas Line Webinar
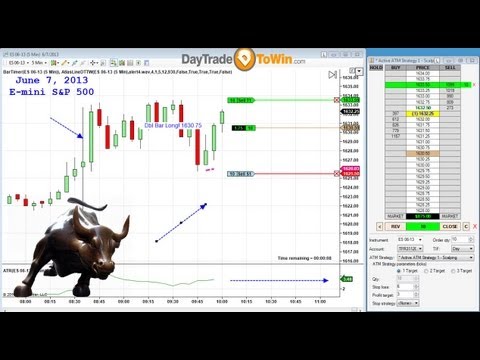
» Get the Atlas Line « At about 5:30 into the video, you can see John Paul enter a live trade in front of the attendees. The Atlas Line said to go long at 10:00 a.m. Using his live account, he bought the market at 1630.50. The ATR was at 3.48, so John Paul’s profit […]
2 Points in Under 2 Minutes While Trading the E-mini
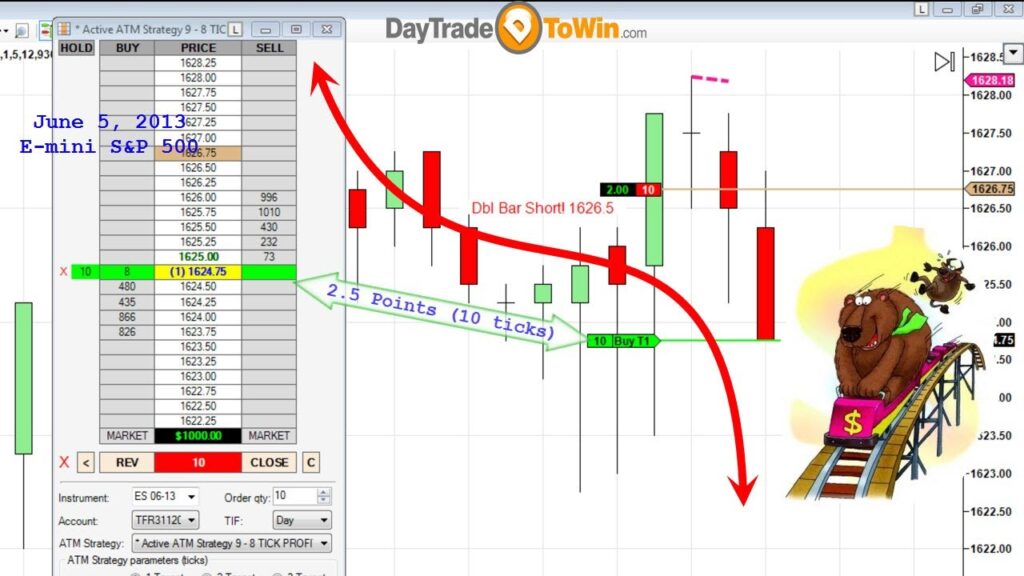
» Get the Atlas Line « On June 5, 2013, the Atlas Line produced a short signal at 1626.50 on the close of the candle at 9:55 a.m. US/Eastern. Remember, the rule is two closes above or below the line for an entry signal. You can see how there was a doji that precedes the […]
Using Atlas Line for 3.25 Points on E-mini S&P
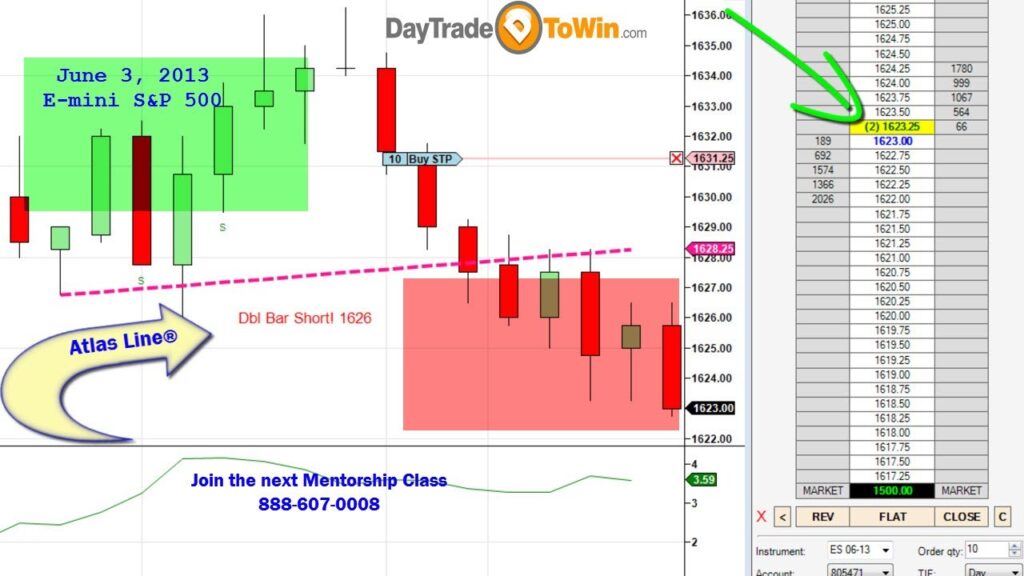
» Get the Atlas Line « On June 3, 2013, the Atlas Line produced a Short signal around 11:00 a.m. Note that the actual text for the Atlas Line always plots a few bars back from the actual entry. So the price and time for the entry is really 1626 because you enter when there […]
Live Price Action Webinar with NinjaTrader
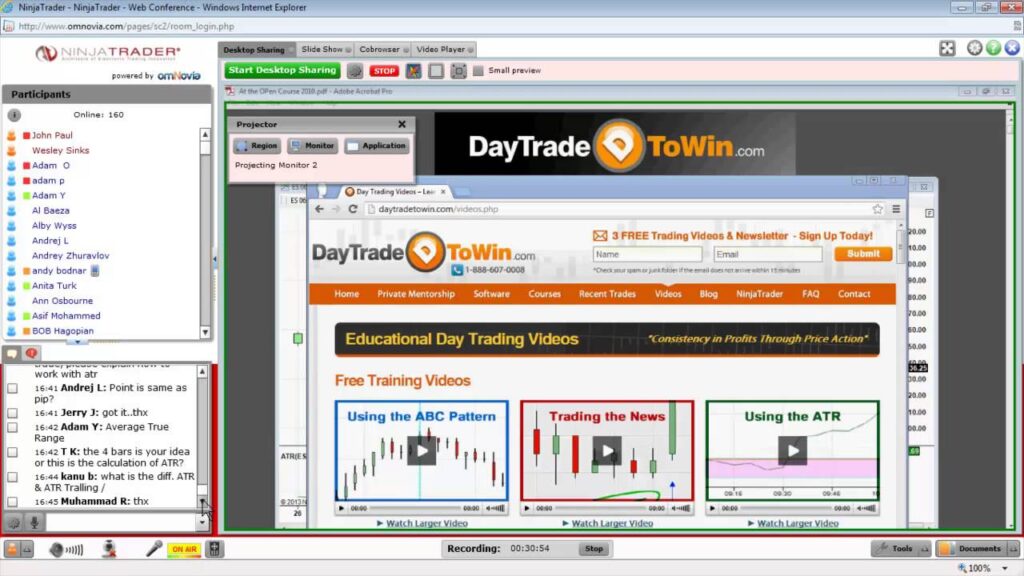
NinjaTrader sponsored John Paul’s price action webinar yesterday. John Paul begins the hour-long webinar by talking about one of our old courses, the ATO (At the Open). Now only available in the Mentorship Program, the ATO teaches you how to trade the opening move in the E-mini S&P. This exact price pattern occurs on a […]
See the Euro FX 6E Trading Live with Atlas Line
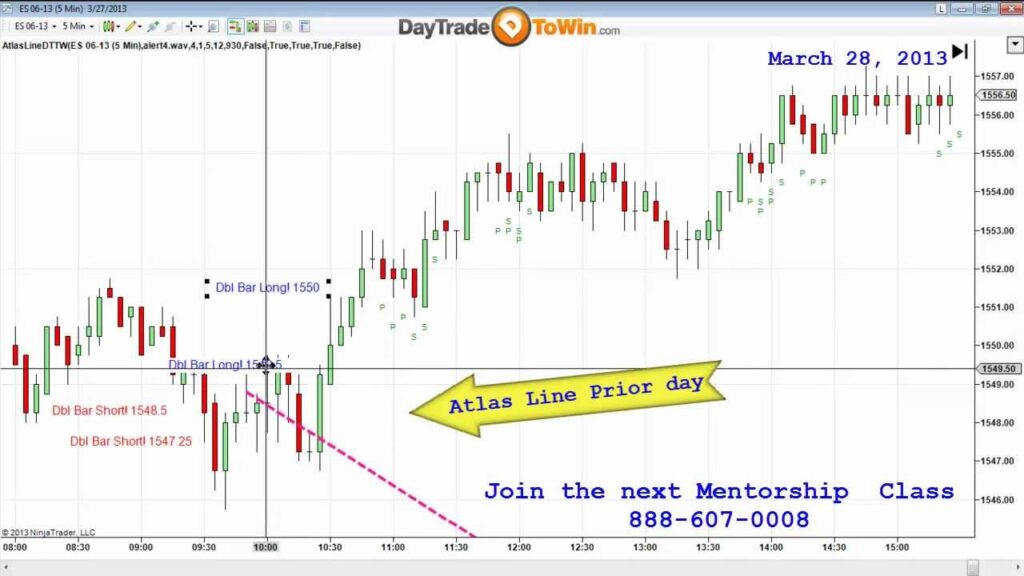
» Get the Atlas Line Signals « Thursday of last week, John Paul conducted a live webinar demonstrating the Atlas Line using real-time market data. For those who don’t know, the Atlas Line is software that plugs into NinjaTrader. On your NinjaTrader chart (or TradeStation or eSignal), the Atlas Line tells you the exact price […]
Atlas Line Results for February 2013
Only a monthly basis, we like to report how well the Atlas Line has performed. February 2013 was another successful month as indicated by these totals… February, 2013 Total # of trades = 44 Total # of days traded = 19 Total net profit or loss (using 10 contracts excl. fees, slippage, etc.) = +$10,375 […]


