Latest S&P 500 ‘Death Cross’ Sends Mixed Signals About Market Direction
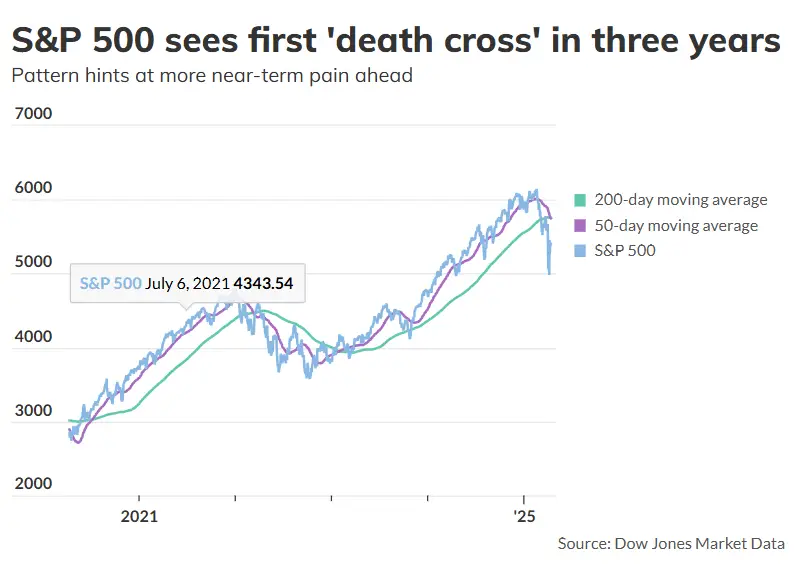
Despite a continued rebound from last week’s gains, the S&P 500 reached a potentially bearish technical milestone on Monday — a “death cross,” its first since March 2022, according to Dow Jones Market Data.
A death cross occurs when the index’s 50-day moving average falls below its 200-day moving average. While many technical analysts view this as a warning that a market correction could deepen into a more sustained downtrend, the signal isn’t always clear-cut.
The S&P 500 isn’t alone. With U.S. equities struggling in 2025, the small-cap Russell 2000 index and even shares of Tesla Inc. have also formed death crosses in recent weeks.
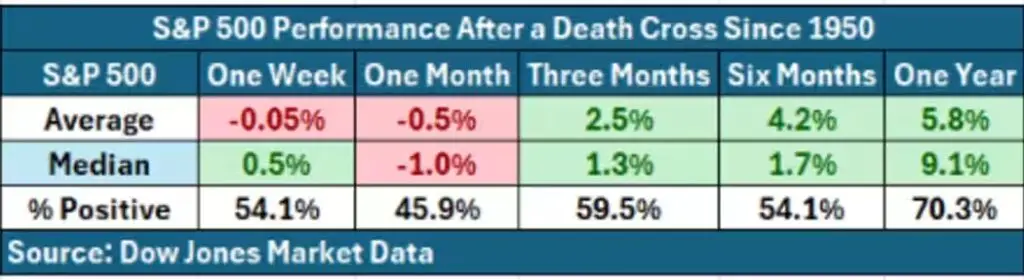
Still, history suggests that investors shouldn’t panic. While the S&P 500 has often seen further losses shortly after a death cross, those declines have typically been temporary. On average, the index has posted gains three, six, and twelve months after these events.
Paul Ciana, chief technical strategist at BofA Securities, notes that the context matters. If the 200-day moving average has declined over the past five trading sessions, it could indicate more near-term weakness and a possible retest of last week’s 2025 low.
However, not everyone sees the death cross as a cause for concern. Craig Johnson, chief market technician at Piper Sandler, believes these patterns are lagging indicators. In his view, they often appear near the tail end of a downtrend — and could actually signal a coming bounce or “snapback” rally.
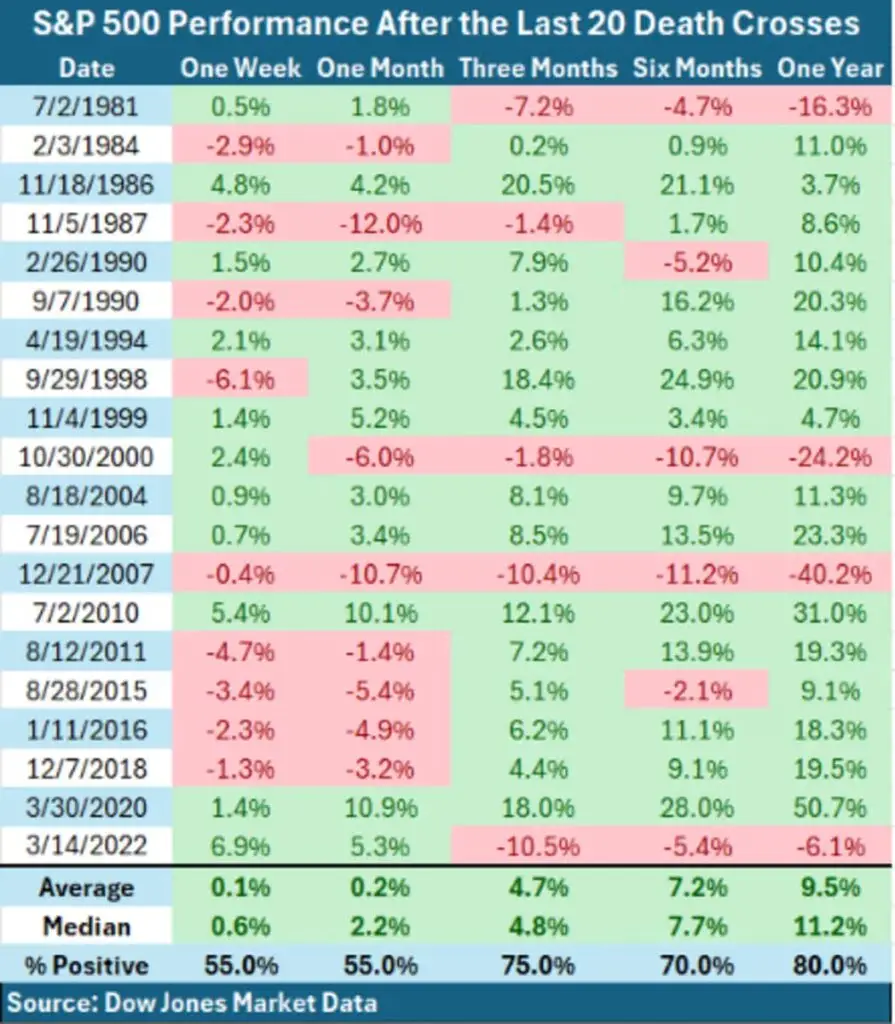
Recent history supports this mixed view. The S&P 500 was down a year after its last death cross in March 2022. But following the March 2020 death cross, stocks surged more than 50% over the next year.
On Monday, stocks closed higher across the board, although they pulled back slightly from their session highs. The S&P 500 rose 0.8%, while the Nasdaq Composite and Dow Jones Industrial Average added 0.6% and 0.78%, respectively.
