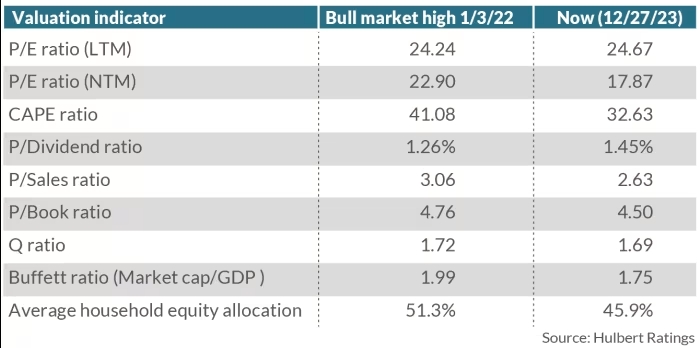
U.S. stocks are currently trading at levels comparable to or slightly above those seen at the bull-market peak in early January 2022.
This observation, however, should be tempered by the fact that the market at that time was highly overvalued. While the bear market of 2022 has brought about some improvement in valuation metrics, it’s essential to recognize that stocks remain more overvalued than at almost any other point in U.S. history.
A closer look at various valuation indicators reveals a mixed picture. In most cases, current valuations are lower than those recorded in January 2022, except for the price/earnings ratio based on trailing-12-months as-reported earnings, which is higher today. Despite these modest improvements, it’s crucial to note that the market was exceptionally overvalued in early 2022.

The Cyclically Adjusted P/E (CAPE) ratio, for instance, has shown significant improvement over the last two years, dropping from 41.1 to 32.6. However, even with this decline, the current CAPE ratio remains higher than 90.1% of all monthly readings since 1881, according to data from Yale University’s Robert Shiller.
To contextualize the CAPE’s improvement, an econometric model predicting the S&P 500’s inflation-adjusted return over the next ten years was considered. At the January 2022 high, the model forecasted a 10-year real return of minus 2.3% annualized, whereas the comparable forecast today is a gain of 0.7% annualized.
While positive, this projected return isn’t particularly compelling, especially when compared to a guaranteed return of 1.7% annualized above inflation offered by 10-year TIPS from the U.S. government.
It’s important to note that valuation indicators have limited predictive power for short-term market movements. Even if the analysis suggests mediocre returns over the next decade, the market could still perform well in the short term.
Investors should approach the current market conditions with a nuanced understanding of both short-term dynamics and the longer-term valuation landscape.


