Day Trading Get Started Guide
On this page, we’ll teach you how to get started day trading. Download the latest version by filling out your info and email below. You’ll find a ton of useful information and be up and running in no time. Click here for the PDF version.
Keep reading to learn how to:
- Get live trading software on your computer
- Practice live trading like the pros
- Understand the costs of day trading
- Get up to speed quickly for maximum success
Have you ever heard of futures or currency trading?
Ever considered day trading for part-time or full-time income?
Yes, it is possible learn day trading to make a living day trading from home! John Paul, founder and lead educator at DayTradeToWin, knows because he’s done just that. The goal is to recognize specific market conditions while minimizing risk for consistent profitability. Through our courses and software, we teach people from all experience levels our exclusive techniques. Consider this document to be a free day trading course.
We’ve helped many new beginner traders like you who have never day traded. We’ve helped them get started and learn the correct way to approach the markets. Even if you are an intermediate or experienced trader, the training, support, and methods taught are unique and will add value to your current trading style. Yes, it will take a little bit of time to learn, but so does anything worthwhile. This guide will get you set up as quickly as possible. If you come up across unfamiliar terms, we recommend using our FAQ page as a glossary or contacting us via email.
By the end of this guide, you will be up and running with proper day trading software and real, live data for your charts. You will see real-time price movement as it plots, just like a professional trader. You will also learn three trading methods you can use with your charts. Using these methods you can practice “paper trading,” aka placing simulated trades.
Remember, when trading real money, there is a substantial risk of financial loss. Only trade with money you can afford to lose. Please read the disclaimers at the bottom of this page. Simulated and past performance is not indicative of real-time or future results.
Part 1 – Day Trading Explained
- When we talk about day trading at DayTradeToWin, we are referring to trading futures and currencies from your personal computer. Using your home or office computer, you can watch how the markets move, wait for specific patterns to occur, and place trades based on specific rules. When you watch charts, you are typically watching price move up and down. This is what we call price action. Every trading method we teach is based on price action. We let the market “tell us” when it’s ready for a trade to be placed. We believe price action has benefits over other types of strategies and systems that tend to overcomplicate things and provide mixed signals. Our approach is objective. We will teach you specific patterns, also called “setups,” that you can easily apply. We specialize in price action day trading courses for those wanting to learn how to day trade.
- Did you know that the markets are manipulated every day? Yes, they are pushed and pulled by seemingly invisible forces. Banks, hedge funds, other large investment firms, and automated trading software can push the little guys out of the way. With our price action methods, you will be able to stand your ground for long-term success.
- A trading platform (software) is required to view charts and place trades. Our recommended trading platform is NinjaTrader. We recommend NinjaTrader because of its efficiency and flexibility. The NinjaTrader software is provided for download later in this guide. The latest version is NinjaTrader 8. This Guide is a great way to learn how to use NinjaTrader. You’ll see the NinjaTrader instructions later.
- In NinjaTrader, markets such as the E-mini S&P and Euro FX are also referred to as “instruments.”
- Indicators are third-party add-on software made by individuals and trading companies. Indicators plug into trading platforms and intend to provide traders with greater insight. Indicators can also be problematic. Too many indicators can clutter your chart or provide inaccurate advice. Many times, traders become too reliant on indicators without understanding the underlying strategy. At DayTradeToWin, we make sure you understand how to recognize trading opportunities so you don’t blindly follow an indicator. Most of our courses come with indicators that can be used as a reference to confirm the strategy. Our most popular indicator is called the Atlas Line.
- Using the NinjaTrader software, you place trades in “sim mode” by default. This is also called “paper trading.” Paper trading with real-time, live data is the best way to practice because it resembles a live trading environment. With either real or simulated trading, NinjaTrader provides a performance history of your trades in the Trade Performance window (NinjaTrader Control Center > New > Trade Performance).
- To trade live with real money, you need to set up an account with a broker. Before trading with real money, we recommend that you practice trading until you are completely confident. The broker will require that you deposit money into the account to trade with. The broker will provide you with a connection to the markets (a data feed) and a user name and password for NinjaTrader. Each broker has specific requirements for leverage and margins. Also, brokers will charge a round-turn fee to handle each trade you make. On average, each trade’s round-turn rate is about $3.90 to $4.50 per trade depending on the broker. Click here to see NinjaTrader Brokerage’s rates. Additional day trading costs are discussed later on.
Part 2 – Day Trading Requirements
- To day trade from home, you will need a computer purchased within the last five years or so. We recommend a computer with Windows 10, at least 6 GB of memory, a recent processor (i.e. Intel i5 or i7 or AMD Ryzen 5, 7, or 9), and an SSD (solid-state drive) with a capacity of 256 GB or greater (though trading software uses relatively little space). Since you will be potentially placing live trades worth thousands of dollars, you should use a computer that’s fast and reliable. Use an anti-virus/anti-malware program to clean up your computer. Also, reduce the number of programs that are running simultaneously to free up memory. A single monitor will suffice, since you will be looking at one market initially. You will also need a fast, stable internet connection. A cable, DSL, or fiber-optic connection will work just fine. Have a technically skilled family member, friend, or professional help optimize your computer.
- To learn day trading, you will need some patient and time to practice. We believe the best time to trade is when the market opens. The E-mini S&P 500’s opening movement starts at 9:30 a.m. US/Eastern and is best for trading until noon US/Eastern. Our methods work outside of these hours, so if you are doing other things during this time, no need to worry. If you are busy all the time, you can practice at your leisure using NinjaTrader’s Market Replay. This feature lets you replay market data back so you can practice as though the data is live.
- For live futures trading, you can open an account of less than $2,500 depending on the broker. This is especially true for the lower-cost Micro E-mini Futures. We typically recommend a minimum account size of $4,000. This helps absorb some inevitable losses. When trading live, we recommend you start with one futures contract and then increase as you learn and become successful. Remember, if you’re new to trading, you shouldn’t open an account right away. You can paper trade for free. Take time to learn how to use NinjaTrader and reference the instructions in this Guide.
- You will also need a plan. You can’t expect to be successful guessing trades. See our day trading courses and software for a variety of strategies that work. You can practice our strategies by paper trading live data. We feel this is the best way to learn how to day trade. Our day trading strategies are based on price action.
- Proper support. Use the following websites to answer your questions:
- Our day trading FAQ page with explanations of popular trading terms and tips on how to trade.
- Our Blog with tips and current events that affect trading.
- Official NinjaTrader 8 video library See what NinjaTrader says about their own platform.
- Investopedia has a large trading glossary.
- CME Group is the world’s leading and most diverse derivatives marketplace. The company is comprised of four Designated Contract Markets (DCMs): CME, CBOT, NYMEX, and COMEX.
- Wikipedia has good information – look up the E-mini S&P.
So you want to eventually trade live, but what are the costs? Remember, when you are DayTradeToWin client, we can provide a practice environment. There is no need to run out and fund a brokerage account right away. However, when you’re eventually ready to trade real money, you should be aware of the costs. Here is a summary:
- When the time comes, start trading slow and steady with one futures contract. Your broker will require probably a margin of about $500 per contract. Check your broker for account requirement specifics. Generally speaking, accounts with greater funding have more of a buffer against loss. You can add more contracts later as you become more comfortable trading.
- A Live NinjaTrader License. Currently, you can practice trading using NinjaTrader for free with live data. When you want to trade real money through NinjaTrader, you can lease the platform quarterly or purchase a lifetime license. The Direct Edition is free but lacks features like ATM Strategies. Click here for all the NinjaTrader purchasing options. Also, check directly with NinjaTrader or your broker for any special promotions.
- Each time you place a trade, your broker will apply a round-turn commission fee (a few dollars). Contact your broker to find the current rates.
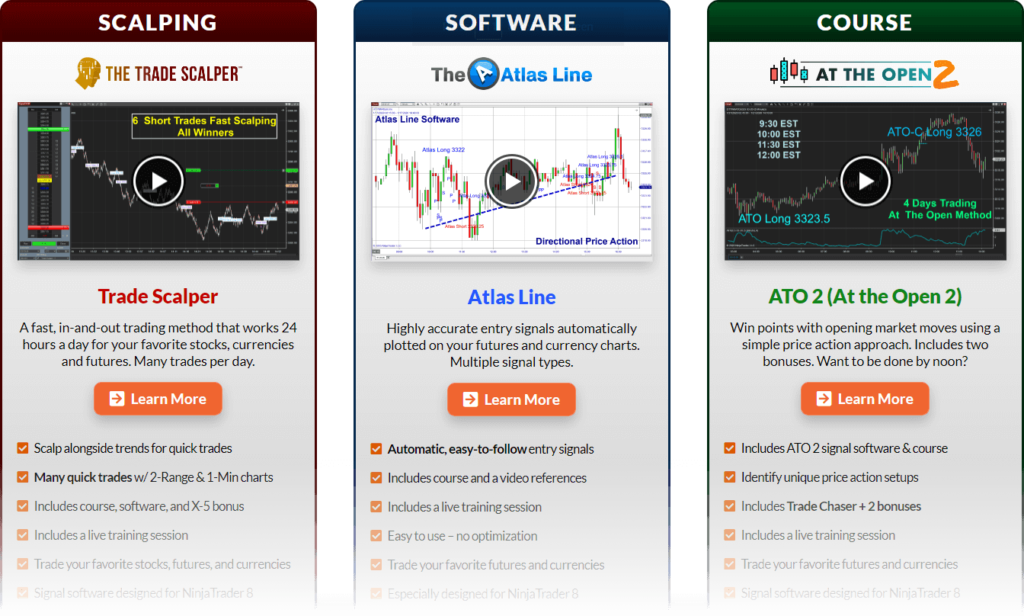
- Of course, we recommend having a winning strategy. The six-month Atlas Line license is a great way to start.
- A reasonably fast, streamlined Windows computer with quick internet access to trade with.
Part 3 – How to Get NinjaTrader and a Live Data Feed
To day trade, you will need a trading platform. We’ve already covered why we use NinjaTrader. Remember, everything we will show you here is entirely free. Now let’s get to it…
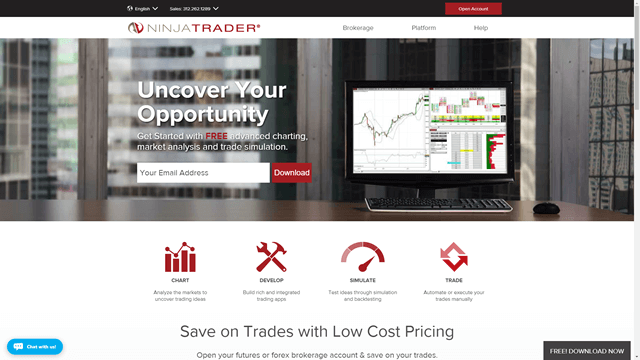
- Click here to visit the NinjaTrader 8 download page. When asked, enter the following key: @CQG-CQG4-D583-40B1-AE74-B79F-705D-7777. Select NinjaTrader 8 and proceed. Save the download to a folder that you’ll remember.
- Run the download (NinjaTrader’s setup program) and follow the instructions to install NinjaTrader. When NinjaTrader is finished installing, you should see two shortcuts on your desktop: NinjaTrader 8 and NinjaTrader 8 (64-bit). The 64-bit version is for computers using a 64-bit version of Windows. It can take full advantage of computers with 4 GB of memory or higher. We recommend the 64-bit version, but the 32-bit will also work. Double-click the NinjaTrader shortcut.
- When NinjaTrader opens for the first time, you may be asked to establish a connection to a data feed. A data feed is a username and password that provides access to real-time market data. At this point, you may click here for assistance with acquiring a practice account (aka data feed) for NinjaTrader. When a two-week practice account expires, you will get an error message when trying to connect. At this time, you can contact us for assistance.
- When NinjaTrader is finished loading, you will see the NinjaTrader Control Center. This is the “home base” that you can open charts from, establish data feed connections, review performance, and so forth.
A word about NinjaTrader and its licensing – again, it’s free to use for simulated trading. You only have to buy a NinjaTrader license when you are ready to trade live
- To add a new data feed, go to NinjaTrader’s Control Center > Connections > configure > in the top-left list, click NinjaTrader Continuum > click add > for Connection name, specify a name like NinjaTrader Continuum and enter the provided user name and password > make sure Demo is checked > click OK > click OK again if any message appears.
- Now we will connect to the data feed. You will need to connect to the data feed every time you open NinjaTrader (unless you clicked the “connect on startup” option when creating the data feed). To connect, go to NinjaTrader’s Control Center > Connections > click the data feed you just added. We recommend against using the startup connection option because it can slow NinjaTrader’s load time. Once you are connected, you should see a green circle in the bottom-left of the Control Center. If you are unable to connect, check your Internet connection and firewall.
- Congratulations! Your NinjaTrader is all set up to receive live data. In Part 4, you will learn how to use NinjaTrader further; i.e. how to open a chart so you can see the live market.
ES is NinjaTrader’s symbol for the E-mini S&P 500. To see a full list of symbols/instruments/markets, go to NinjaTrader’s Control Center > Tools > Instrument Lists.
In different parts of the NinjaTrader software, you may see numbers next to ES or other instruments. For example, ES 12-19. This refers to the contract period. ES 12-19 means the E-mini S&P 500 December 2019 contract. Futures markets like the E-mini cycle to a new contract quarterly. You will always want to trade the correct contract month. The E-mini has four contract months (always the same every year). For example, for 2020, NinjaTrader will use March (ES 03-20), June (ES 06-20), September (09-20), and December (12-20). Contracts usually expire and roll over to the next contract on or around the second Thursday of these months. On the expiration day, you will need to manually switch to the new contract month using NinjaTrader. From mid to late March, you will want to trade the June contract. In June, you will switch over to the September contract, and so on. For information on how to roll over contracts, visit our FAQ page.
Part 4 – Using Charts and Placing Trades
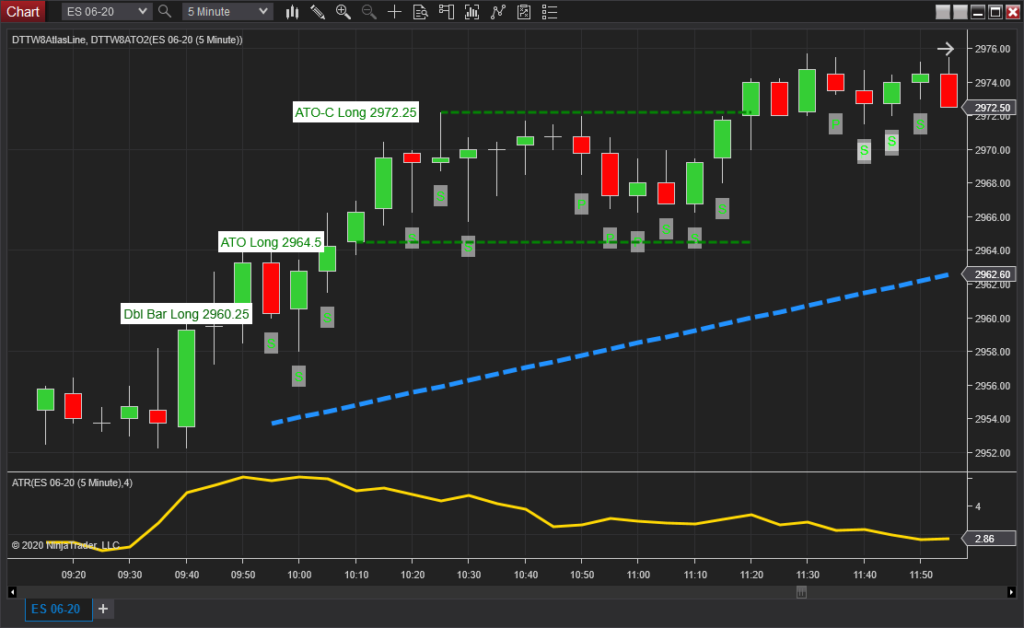
In this example, we will open an E-mini S&P 500 chart.
In NinjaTrader’s Control Center, go New > Chart. In the top-left box, select Futures and then select the ES (e.g. ES 12-19). In the right panel, make sure the Type is set to Minute and the Value is set to 5. This means that you want to open a 5-Minute chart. Change Days to load to 14. This tells NinjaTrader you want to load 14 days of history. You can enter a larger number, but it’s best to keep it under 30 because it can take a while to download all the data. Once you’re satisfied with the settings, click “preset minute” on the bottom-right to save these settings for future use. Most of our strategies use 5-Minute charts, so that’s why you should set up your chart this way. Click OK at the bottom and then the chart will open. Congratulations – you now have your first live trading chart open!
If you’re connected to a live data feed and you’re looking at the chart during market open hours, you should see price movement. By default, price is represented by red and green rectangles. These rectangles are called candles, candlesticks, or bars. We like to use the terms interchangeably, but they all mean the same thing.
By the way, if you were using our Trade Scalper strategy, you would be using a 1-Minute chart because it’s designed for a fast-moving market with many small, quick trades.
Now that your chart is open, we recommend tweaking a few more settings:
- Is your chart a dark color? That’s perfectly fine. NinjaTrader 8 lets you change its color theme (skin) via NinjaTrader’s Control Center > Tools > Options > Skin > select the desired skin. The Light skin is the one that’s used for the pictures in this guide. To apply the skin, NinjaTrader needs to be restarted. It’s probably better to restart NinjaTrader later because there are a few more settings that you may want to change.
- Have you noticed that it’s difficult to tell what day you’re looking at? Add a date and time display to the top-left corner of your chart: right-click the chart > Properties > check “Show date range” (about the third check box from the top) > click OK.
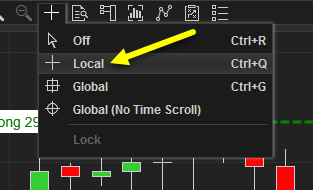
- By default, your regular mouse cursor will be used on NinjaTrader’s charts. We’ve found it better to use a crosshair so you can precisely tell the price and time at any point on the chart. Switch to the crosshair by going to the top of the chart, click the button with the mouse pointer icon, and select Local. See the picture for a reference.
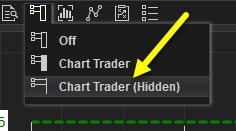
- Later, when you’re placing trades, it would be nice to see what your profit goal (profit target) and maximum loss (stop loss) directly on the chart. You can display the profit target as a green line and the stop loss as a red line by enabling Chart Trader. Enable Chart Trader by clicking the Chart Trader icon and select Chart Trader (Hidden). John Paul prefers placing trades with the SuperDOM instead of Chart Trader. The SuperDOM offers more options.
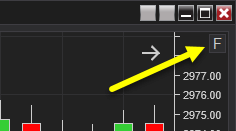
To move along the time axis (go back or forward in time), drag the scroll bar on the bottom of the chart, use your mouse wheel, or hold the Ctrl key while dragging the time axis with your mouse. You can stretch or shrink your view of the time axis by clicking and dragging the time axis with your mouse. To navigate up and down on the price axis, hold the Ctrl key while dragging the price axis with your mouse. You can stretch or shrink your view of the price axis by clicking dragging the price axis with your mouse. If you lose sight of the candles, click the small F (focus) button in the upper-right corner of the chart. This will “lock” your view to the price bars, allowing you to scroll through history without losing sight of price.
Let’s go over a few more charting features that you’ll be using as time goes on…
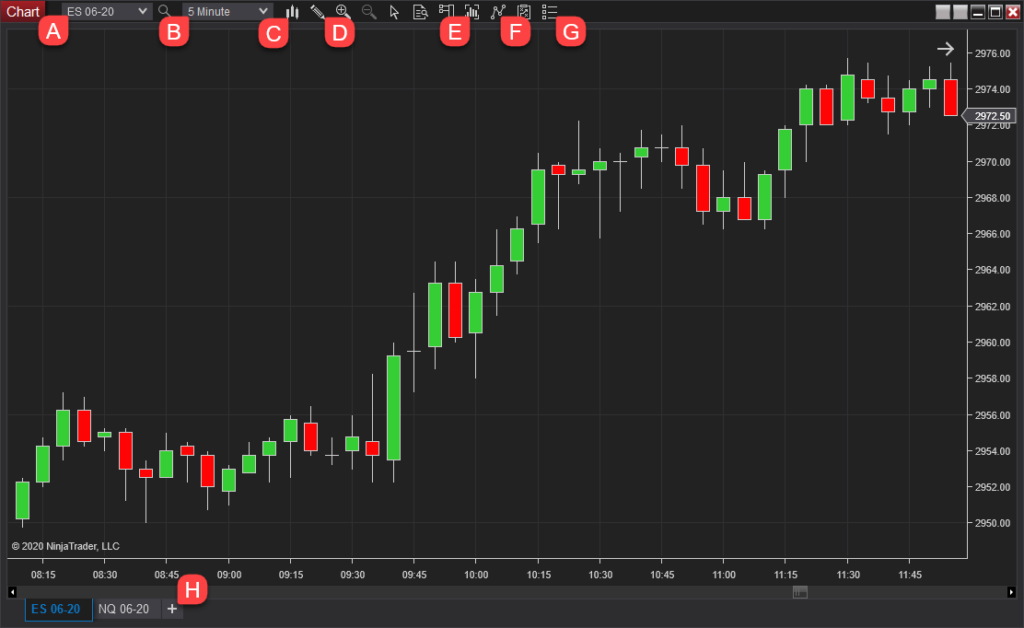
- You can switch the instrument (market) you’re looking at directly via the chart itself. To do so, click the box in the upper-left corner of the chart that contains the instrument, e.g. ES 06-17 in the picture. Notice how the instruments are categorized by type. You’ll probably want to stick with Futures for now.
- You can also switch the time frame. To do this, click the box in the upper-left corner of the chart that contains the time frame, e.g. 5 Minute, and select a new time frame. To get an idea of what one whole trading day looks like, look at an hourly chart. To see what a week looks like, use a daily chart.
- Want to see price represented in something other than candlesticks? Use this button. We prefer candlesticks because they easily tell us the direction price moved (up or down) for the given time frame (5 Minutes, for example), but more on that later.
- Want to add lines, boxes, or other drawing elements to a chart? Use this button. Also, you can memorize the displayed keyboard shortcuts to quickly add drawing elements.
- There are two ways you can customize the chart. This Data Series button will open a window that has many settings that control how the incoming market data is used on the chart. If you want to load more days of history, for example, you can change that here instead of opening a new chart. There are a few options for changing the appearance of candlesticks. The Properties window (G) contains more chart settings. Yes, it would be easier to have all the settings in once place, but you’ll probably rarely need to adjust any settings in the Properties area.
- Use this button to open the indicators window. Alternatively, you can right-click the chart and select Indicators. NinjaTrader includes many indicators to choose from. We typically add the Bar Timer and ATR (Average True Range) indicators to our chart. Go ahead and add them now. Switch the ATR’s Period value to 4 so the last four bars are used in its calculation. The ATR is covered in one of the free training videos we mentioned earlier.
- The Properties window contains more chart settings. You probably won’t use these that often. The Data Series (G) button provides access to more chart settings.
- A new feature in NinjaTrader 8 is the ability to add multiple charts in the same window that are separated as tabs. Back in NinjaTrader 7, you were required to have separate windows for each chart. You can imagine how cluttered your desktop became. Take advantage of this new feature by clicking the plus button, then customizing the new chart as needed.
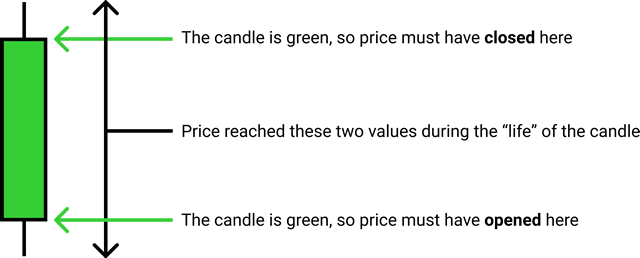
As mentioned earlier, we recommend candle (or candlestick) charts. Why? Because they offer an excellent representation of how price behaved. If you are looking at a five-minute chart, a single candle represents where price moved within those five minutes.
Within five minutes, the candle will begin (or open) at a certain price. At the end of the five minutes, the candle will end (or close) at a certain price. If the closing value is higher than the opening value, the candle is green. If the closing value is lower than the opening value, the candle is red. While a candle is plotting in real-time, the current price of the candle is treated as the closing price, so that’s why you will see a candle change colors. Once a candle closes at the end of the time frame (five-minutes or whatever time frame you’re using), the color will not change.
On occasion, you will see “empty” candles that look like this: †. These candles are called “dojis” and occur when a candle’s opening and closing prices are the same. Be sure to zoom in on your chart to see if a candle is truly a doji.
To better understand candles, you need to know more about price. In the E-mini S&P, the smallest amount price can move up or down is .25. This is called a tick. Four ticks are called a point. Each E-mini tick is worth $12.50. Therefore, one point is worth $50 ($12.50 x 4 ticks aka one point = $50). Our methods at Day Trade to Win focus on winning you two to four points ($100 to $200) each day, per contract. If you traded two contracts, you would multiply your profit or loss accordingly. If you trade 10 contracts with consistent success, you can make quite a living! Each market has a unique tick size, so be sure to check with your broker or the exchange for price details.
Now that we have a chart open, how do we place trades? There are a couple of different ways you can place trades, or orders, as they’re often called. The first way is to use NinjaTrader’s Chart Trader, as mentioned earlier. You can choose the non-hidden option to see a panel that allows trades to be placed directly on the chart. While this feature is useful, we prefer the Dynamic SuperDOM. We refer to the Dynamic SuperDOM as the “DOM.” Think of the DOM as a remote controller for interacting with the market. In other trading platforms, the DOM is called a price ladder or matrix. Open a DOM via NinjaTrader’s Control Center > New > SuperDOM (Dynamic). The DOM window should say “Sim101” near the bottom to indicate that you are trading with NinjaTrader’s simulation account. Click the Instrument drop-down box and select the market that you have open in your chart. Providing you are connected to a real-time data feed and the market is open, you should see price moving on DOM along with numbers in the Buy and Sell columns.
Now, perhaps the most difficult part of trading is understanding the different types of orders and how to place them using the DOM. We highly recommend that you watch John Paul’s SuperDOM video and the SuperDOM training videos from the NinjaTrader video library. Click the “+” to see the video selections. Also, take a look at the Order Entry section, specifically the SuperDOM Order Submission Overview video. NinjaTrader also conducts webinars to teach SuperDOM basics.
What happens when you’re done with trading for the day? We recommend leaving all your charts and DOM windows open. Don’t close anything. Go to NinjaTrader’s Control Center and click the X in the upper-right corner. NinjaTrader will ask if you want to save your workspace. A workspace is all of NinjaTrader windows you have open (charts, DOMs, etc.). If you are happy with your setup, select Yes. If you have made a mistake and closed your charts, you probably should click No (so any existing good workspace will not be saved over). By saving your workspace, the next time NinjaTrader loads up, all of your charts and other windows will load up automatically. It’s a great time saver!
Part 5 – Learn Our Trading Strategies
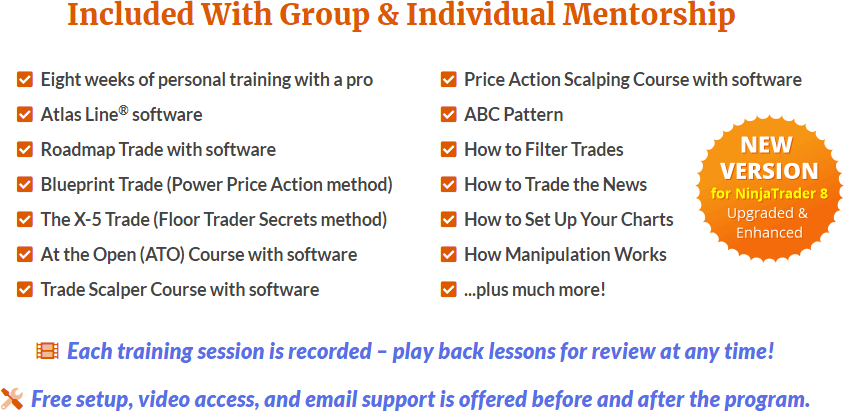
Ready to continue to learn day trading from home? Now that you are comfortable placing simulated trades with your real-time data feed, you need to learn a day trading strategy that stands a good chance of producing consistent results. Our full eight-week training course called the Mentorship Program is the best way to learn everything we offer. All price action trading courses and software are included with lifetime licenses. Training is twice a week, live, with John Paul. Click here to find out more.
You can start with three free trading strategies by clicking here.
At DayTradeToWin, we teach traders how to be consistently successful. Take a look at our day trading courses to find out more. The most common question we get is, “What course is right for me?”
The Mentorship Program is suitable for beginners as well as advanced traders. Frankly, it’s the best option because John Paul will personally train you and show you everything he knows. However, some traders start off with the 6-Month Atlas Line license, Trade Scalper, or ATO (At the Open).
Our Mentorship Program places you with John Paul in a virtual training room where you can learn his methods by looking at his daily charts. He fully explains the rules for every trade: how and when to enter, where your profit target and stop-loss should be, what to do if a trade goes against you, and much more. In total, about 10 unique strategies are taught. By the end of the eight weeks of training, you know exactly how to handle any trading situation, take profit, and minimize risk. Keep scrolling for a list of what you will receive.
Watch the many video testimonials from our students.
To register for the Mentorship Program or inquire about costs, email us at support@daytradetowin.com or call us at 1-888-607-0008.

