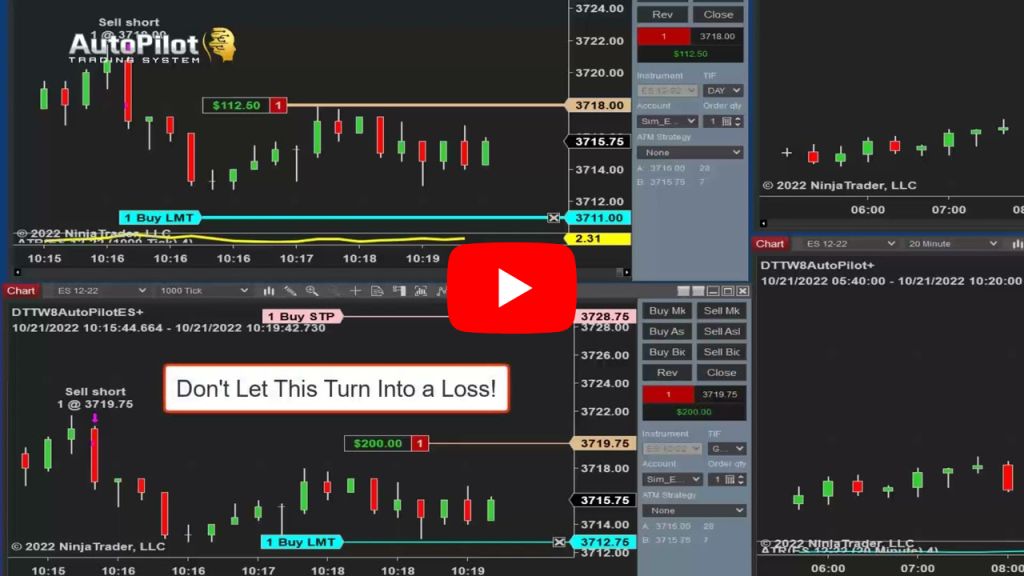
Hello, everyone, My name is John Paul, founder of Day Trade To Win; I will show you something a little different today. I have an automated trading system called autopilot, which is currently trading.

<< Watch professional trading software that consistently prints the best signals >>
These are the first trades of the day. I have it on a couple of different charts as well, so I want to see how this performs for today, but I do want to start off with how automatic trading systems work a little bit. Why or why not? You should be using them because some Traders, like automatic trading systems and other Traders, prefer to trade in their own right and be in control. Now before we begin, remember that trading is risky; please don’t trade with funds you can’t afford to lose talking to your broker, understand? There are risks involved with any type of trading that you’re doing so.
What you see here on the two charts to the left, it’s a 1000-tick chart, and the parameters are a little different, but the trade is basically the same. It’s a short trade, and you see the targets are automatically placed for you.
So the entries are placed for you automatically, and the targets and the stops are placed for you as well automatically. But there is a couple of things, though, that I believe will help any type of automated trading system, even something that maybe you’ve been doing on your own as well with automated Trading. Typically, you can, with the autopilot, just turn it on and walk away, but it’s always good at first, at least for the new traders, to kind of be in front of the computer and see how it works.
Even you could manage the orders yourself. So if I wanted to move any of these orders, the Target or the stop to get out of the trade, you have the ability to do so. So I think, as a first-time, user of using any type of trading automated trading system, don’t just turn it on and walk away. You can do that after you have some experience in working with the system itself, but I think it’s also good to understand what makes the system and to get out or to get in if the conditions are changing.
So these are some characteristics of automated trading systems. I think that Traders should focus on and I’ll give you a great example here. Looking at the bottom left-hand chart, we see that the market hit the target of 37 12 75. So it was short at 37 1975, and it hit the target at 37 12.75, but it didn’t get filled, and it didn’t get filled because it’s using a limit order. So how do we respond to that? Well, I’m letting the system run, I’m letting it do its thing, but if I notice that it just and actually just now, once again, it came within a tick of that Target, and it’s uh moving away from it. So, as a Trader, I always look at this, and I think about price action. I think about managing the trade. I say to myself: I do not want to let this turn into a losing trade.
So when I think of this, I always consider whether or not it touched the target, if it just missed it by a tick or two. Do I want to let this continue on and potentially become a loss? So, in the back of your mind, that has to be weighed; I always say, get out of the trade if you’re in front of the automated trading system, the autopilot trading system – and you see this occur – we do not want to see this go back up, go Beyond, where you entered and potentially become a loser, so I always recommend keeping an eye on it, at least at first, so you have a good understanding.
Do not let this go much higher Beyond where the entry is. So if the entry is 37 1975, make sure to close out the position just above that; if it happens to not come back and hit your Target now, the autopilot trading system does have several bars or several candles that allow you to Get out of the trade and that’s a good thing because I’ve always talked about a time-based stop. I’ve always talked about how you can limit the amount of Risk by limiting the amount of time that you’re in a trade. This is a little different if you’re, using a tick chart or a volume chart, or a range chart because it goes by many bars.
So there are several categories called some bars that are that is built into this. That says, get out of the trade after 10 bars, 20 bars, 100 bars, 80 bars, and this happens to be 85 bars. So when you’re trading with a 1000-tick chart, the value of 85 bars in trade is what I’m using to get me out. So again, once again, you see here that it’s hovering right at the target. At 37, 12 75 on the chart here at the lower left hand, chart and submitted. As a matter of fact, it just submitted. It just got filled, and once again, it canceled and re-entered into the market and, or at least the bottom chart did, and the top chart is trying to get into the market at either 37, 13 quarter, or 37.
if you’re new to day trading and want to learn more about the benefits of trading the markets, visit daytradetowin.com, join the next mentorship class starting later this month, and subscribe to the day trade to win YouTube channel. We focus on price action and work exclusively with new and beginner traders who want to learn more about how to prosper from Trading.


