Economic Woes and Dow Drops: A New Market Reality?

Strategist: Selloff Reflects ‘Buy the Rumor, Sell the Fact’ Reaction to Fed Rate-Cut Signal A spate of weaker-than-expected economic data contributed to Thursday’s selloff, pushing the Dow Jones Industrial Average toward its largest one-day drop since May. Bad economic news translating into bad news for stocks seems logical but contrasts sharply with the pattern seen […]
4 Tips to Master Day Trading Price Action 🚀

Hello, Traders! Today, we’re diving into some essential price action techniques that can significantly enhance your trading strategies, whether you’re dealing with stocks, Forex, currencies, or futures. For demonstration purposes, we’ll focus on the E-mini S&P. Before we get started, remember that trading is risky. Please ensure you have the necessary funds and risk tolerance […]
The Great Rotation: Top S&P 500 Losers in July
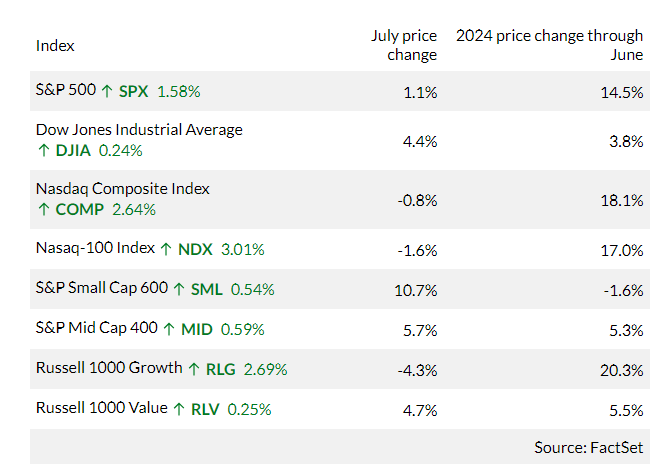
Seven months into 2024, the stock market has enjoyed a strong performance, but July marked a significant shift. A “Great Rotation” began, moving investor funds away from Big Tech and towards value stocks and small-caps. On Wednesday, MarketWatch’s Joseph Adinolfi summarized July’s stock-market dynamics, highlighting how expectations of a change in Federal Reserve policy prompted […]
Wall Street Debates Treasury’s Market Influence
A newly published white paper has sparked debate on Wall Street and in Washington by accusing the Treasury Department of excessively relying on short-term Treasury bills to manipulate the economy for political purposes, potentially risking a resurgence of inflation. The paper, released last week, argues that the Treasury’s strategy of financing a significant portion of […]
Why Traders Are Eyeing a Different Central Bank This Week
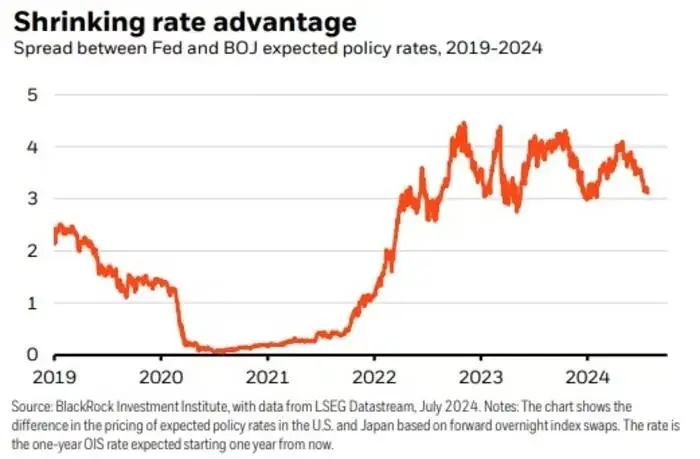
This week, three of the world’s most influential central banks will announce monetary policy updates within a 32-hour span. On Thursday, the Bank of England might reduce borrowing costs, while the Federal Reserve is expected to hold rates steady on Wednesday but may hint at a potential rate cut in September. However, the most critical […]
Tech and Small-Caps Stock Brace for Fed Decisions
A rate cut isn’t expected in the coming week, but the Fed could signal if small-caps can keep up their winning streak. A market-moving force might soon impact a rapidly evolving stock market. U.S. equities were particularly volatile last week as investors contended with a sharp selloff in big-tech stocks and a rotation into small-cap […]