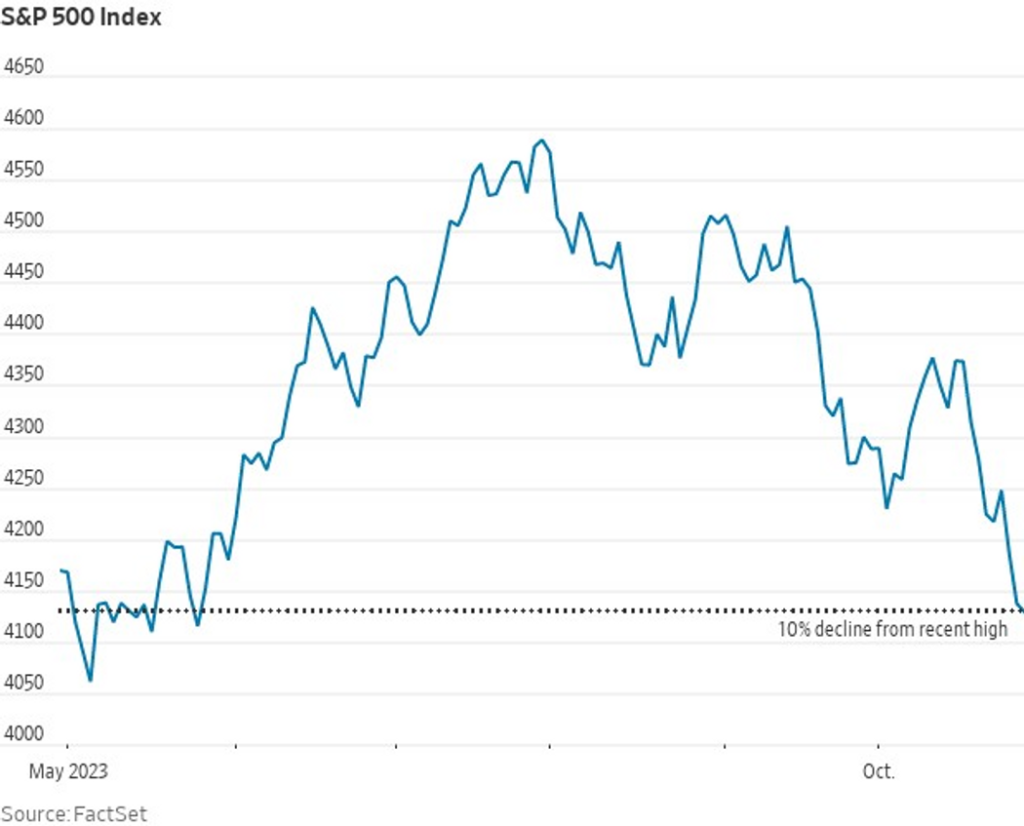
On Friday, the S&P 500 index concluded the trading session in correction territory, marking the 103rd occurrence in its history.
The measurement of U.S. large-cap equities, SPX, experienced a decline of 19.8 points, representing a 0.5% drop to close near 4,117, according to preliminary FactSet data. This descent signifies a 10.3% decrease from its previous cyclical high of 4,588.96 recorded on July 31, 2023.
The Nasdaq Composite similarly slipped into a correction phase last Wednesday.
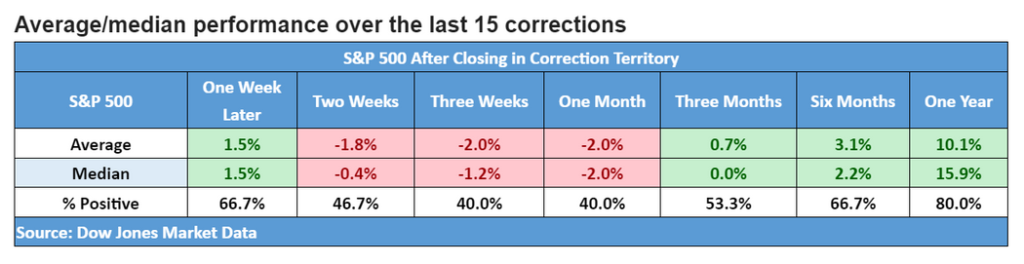
Historically, during the past 15 corrections in the S&P 500, it took an average of three months for the index’s performance to rebound, with an average gain of 10.1% one year later.
Since 1928, following a correction, the S&P 500 has typically shown an average annual rise of 9.1%.
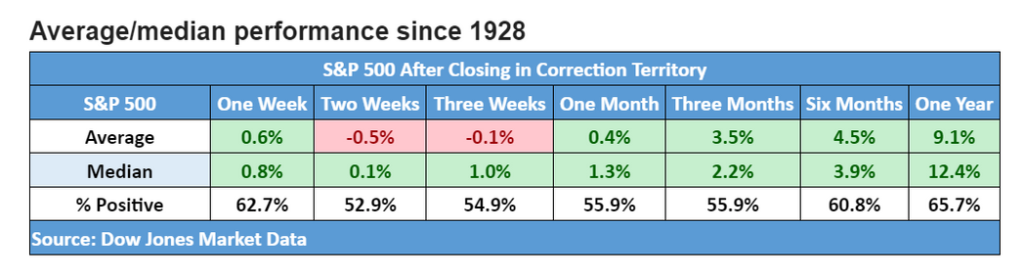
DOW JONES MARKET DATA
Despite these corrections, the S&P 500 has shown a 7.2% increase year-to-date. The Nasdaq Composite has surged by 20.8%, while the Dow Jones Industrial Average is down by 2.2% for the year, according to FactSet data.
