Here’s a two-day video recap of various trading signals, including the Atlas Line and Trade Scalper.
Today, Dec. 30, 2020 may be the last “normal” volatility day of 2020, as New Year’s Eve (tomorrow) may have periods of low volatility. For yesterday, Dec. 29, you’ll see a nice Atlas Line short signal that had a profit target of around four points. The prior day’s Atlas Line gave a nice signal as well – in the long (buy/up) direction. You’ll see the additional Strength and Pullbacks signals for both days as small S and P text next to the corresponding candles. Towards the end of the video, you’ll see recent Trade Scalper signals.
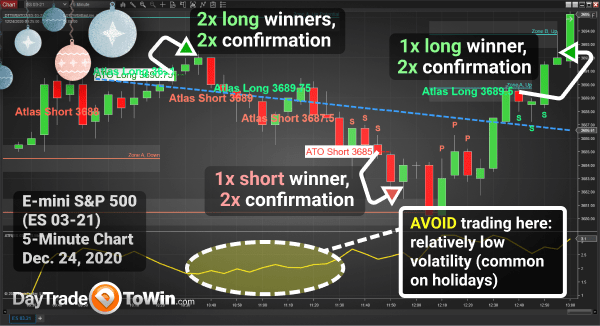
When the market drops into one of these low-volatility areas around major holidays, you may want to sit on the sidelines. The ATR with a period value of four is helpful for gauging volatility. In the chart image below, take a look at the low-volatility period for the E-mini S&P chart on Christmas Eve, Dec. 24, 2020. As shown, we were more confident when at least two systems/signals confirmed one another (e.g., Atlas Line and Trade Scalper, Atlas Line and Roadmap, or similar combinations).

Want to get all of our trading courses and software in one complete package? Enroll in our eight-week Mentorship Program.
John Paul is still predicting that a significant portion of early January 2021 trading will be a “wild ride” sell-off. Our prior video explains this further. In short, he expects a period of bearish (sell/down) activity during the earlier portion of next month. If this occurs, you can look for short signals/trades with our various trading systems.
Sometimes, it helps to have a bigger picture to boost confidence for intraday opportunities. The Atlas Line is especially useful in this regard, as it provides an overall “guideline” for trading short or long for a given day. The video above explains this around the 1:50 mark.
By the way, we hope you and your family have a healthy, joyful, and prosperous New Year!


