The current trajectory of major U.S. equity indexes suggests a consistent upward movement, but this trend isn’t mirrored by individual stocks within these indexes.
Observations from strategists at Charles Schwab & Co. shed light on this contrast between the relatively steady performance of overall equity indexes and the more erratic behavior of their constituent stocks. Despite the S&P 500 reaching record highs in 2024, the average stock within the index has exhibited significant volatility.
According to Kevin Gordon, a senior investment strategist at Schwab, this divergence is atypical of traditional bull markets, signaling a unique market cycle. Liz Ann Sonders, Gordon’s colleague, likened the current market to a duck: seemingly calm on the surface but characterized by frenetic activity underneath.
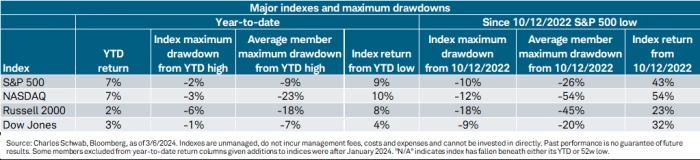
This discrepancy is particularly pronounced in the Nasdaq Composite, where the index itself has experienced minimal downturns while individual Nasdaq stocks have seen substantial declines.
This trend persists when analyzing performance since the onset of the bull market in October 2022. Despite the S&P 500’s impressive 43% increase during this period, the average index stock has faced a 26% pullback.
Similar patterns emerge in indices like the Russell 2000 and the Dow Jones Industrial Average.
Gordon suggests that this volatility gap between indexes and individual stocks highlights an imbalanced market, where the stellar performance of a few stocks masks the weaker performance of many others. Approximately half of S&P 500 constituents are trading below their January 2022 levels, an unusually high number for this stage of a bull market.
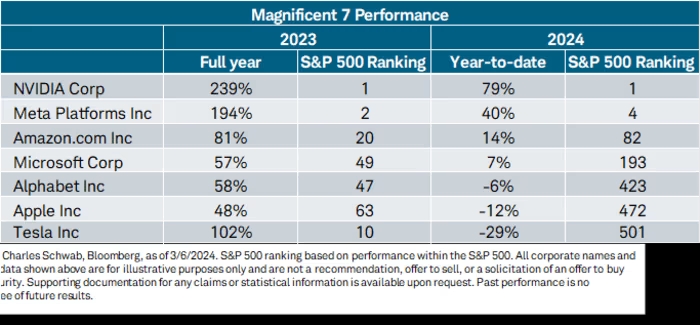
However, investors tracking index funds have benefited from the exceptional performance of a select few mega-cap stocks, which have more than compensated for broader weakness. These stocks, dubbed the “Magnificent Seven,” including Nvidia, Microsoft, Apple, Amazon, Meta, Alphabet, and Tesla, have been instrumental in driving the S&P 500’s gains.
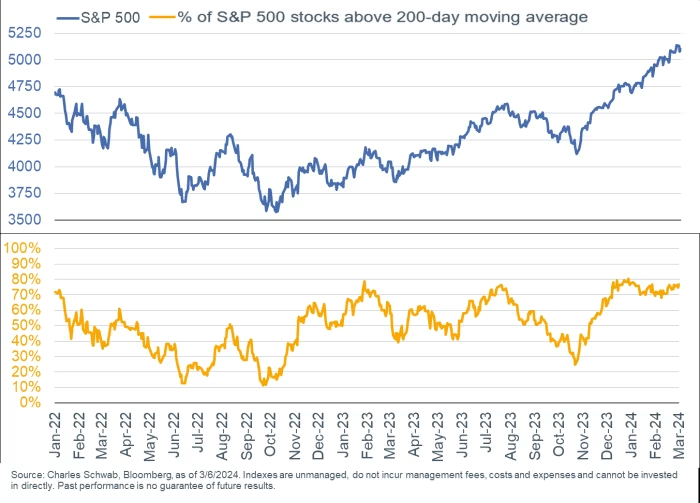
While market breadth has shown recent improvements, indicating more individual stocks participating in the rally, it hasn’t been a linear progression. The proportion of stocks trading above their long-term averages has risen since the start of the year but remains below peak levels seen in December.
