A VIX Spike Can Signal Opportunity — But Expect a Wild Ride
A sudden surge in the VIX can be a bullish sign for stocks, but it also brings the kind of volatility that can shake investors out of their positions.
If the VIX at the end of March holds near current levels, a cautious approach would suggest dialing down your equity exposure for April to around 47.6%.
The Cboe Volatility Index (VIX), also known as Wall Street’s “fear gauge,” more than doubled over just 16 trading days from mid-February to last week. Recently, it’s been higher than 92% of all daily readings since 1990 — a level that contrarian investors typically view as a bullish signal, particularly when the spike happens this fast.
However, while a high VIX can sometimes precede market gains, stocks historically perform better — and with less stress for investors — when volatility is low. In other words, sticking to higher equity exposure when the VIX is low may actually lead to better long-term returns.
This approach is supported by research from finance professors Alan Moreira (University of Rochester) and Tyler Muir (UCLA) in their study “Volatility-Managed Portfolios.” They designed a model showing that the market tends to deliver stronger, more stable returns when volatility is subdued.
How to Apply Their Strategy
Following their method is surprisingly simple:
- Choose a target equity allocation based on a normal, “middle-of-the-road” VIX level.
- Each month, adjust your equity exposure by multiplying that target allocation by the ratio of your chosen VIX baseline to the prior month’s closing VIX level.
For example, let’s say your target equity exposure is 60%, and your baseline VIX is set at its historical median of 17.61. With a VIX reading of 19.63 at the end of February, your equity exposure for March would adjust down to 53.8%. If the VIX stays where it is now at the end of March, the model suggests reducing to 47.6% for April.
Since 1990, this simple version of their strategy has outperformed a buy-and-hold approach on a risk-adjusted basis, delivering a Sharpe ratio of 0.99 compared to the market’s 0.78. Notably, it has continued to outperform even after their research began circulating in academic and financial circles.
The Contrarian Trap
Contrarian investors aren’t entirely off base — the market can indeed rally after periods of extreme fear. But they often underestimate the violent swings that come with such rallies. While average returns can be higher after big VIX spikes, the ride tends to be rougher.
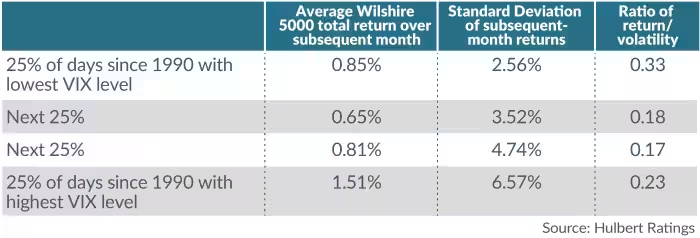
Data going back to 1990 shows that although the average return in the month following the highest 25% of VIX readings is nearly double that of periods with the lowest VIX levels, the volatility of those returns is nearly three times higher. In other words, the reward-to-volatility tradeoff isn’t as attractive.
What This Means Now
With the VIX firmly in its highest historical quartile, the market may still move higher in the coming month — but if it does, expect a bumpy ride. Staying disciplined and adjusting your equity exposure according to volatility may help you capture returns without getting thrown off course by market turbulence.

