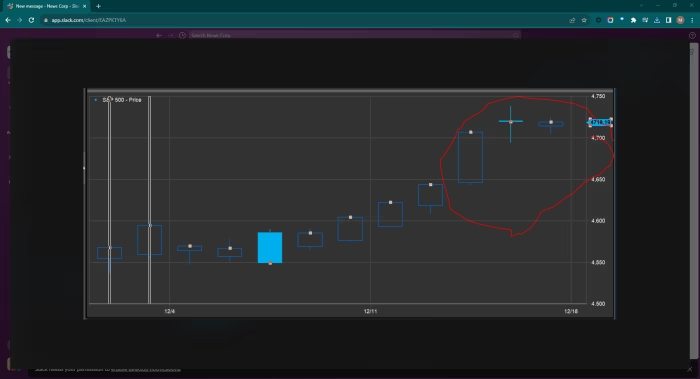
A double ‘doji’ has appeared in the candlestick charts of the S&P 500, suggesting the potential for a significant move, though the direction remains uncertain.
Despite a remarkable surge, a hint of bearish sentiment is emerging in a major U.S. index. The S&P 500 is within 2% of its record high, last achieved on January 3, 2022, and the Dow Jones Industrial Average has notched three consecutive all-time highs, aiming for a fourth on Monday.
However, a historic charting technique revealed a foreboding sign that could signal a reversal of the bullish trend in the widely observed stock-market index. Following a robust rally post the Federal Reserve’s latest meeting, the S&P 500 displayed a classic doji chart on Thursday, followed by a less conventional doji formation on Friday.
In the realm of candlestick charts, a “doji” pattern, originating from Japan over 200 years ago, is interpreted by market analysts as indicative of future market movements based on investor psychology. Dojis, resembling crosses due to their thin bodies reflecting close opening and closing prices, accompanied by equal-length vertical lines or “wicks,” signify the day’s trading range.
MarketWatch‘s Tomi Kilgore likens doji patterns to the moment a ball freezes midair before descending after being thrown upward. These patterns are particularly noteworthy after significant gains, such as Wednesday’s 1.4% rise in the S&P 500 and the Dow Jones breaching 37,000 for the first time.

The importance of the doji lies in its ability to help assess whether an asset is at its peak, ready to reverse gains, or if there’s further room for growth. Steve Nison, credited with introducing candlestick charts to the West, notes that a doji in an extended rally signals buyer indecision and potential for a reversal.
However, it’s crucial to emphasize that a doji doesn’t guarantee a momentum reversal but provides insight into market psychology. Vladimir Ribakov, writing for TradingBud, sees the doji pattern as a temporary balance of power between buyers and sellers before a major move.
The formation of two consecutive dojis, as seen in the S&P 500 on Thursday and Friday, increases the likelihood of a substantial move in either direction. Ribakov suggests a powerful move may follow, leaving the outcome uncertain between bulls and bears.
Market optimism stems from investor bets on the Federal Reserve not only halting interest rate hikes but also making significant rate cuts, potentially reducing benchmark rates from the current 5.25%-5.5%. The Fed’s dot plot projects around three rate reductions, implying at least a 0.75% cut.
While the Fed’s shift from rate hikes has lowered yields for benchmark bonds, reducing overall borrowing costs, the battle between stock bulls and bears hinges on the success of the Fed’s soft landing attempt in 2024. The odds seem favorable, but the prospect of numerous rate cuts raises concerns about the economy’s stability in the coming year.


