Will the recent surge in Big Tech lead to a broader recovery in the stock market as the S&P 500 approaches an end to the bear market?
The benchmark for large-cap stocks is experiencing its lengthiest period in bear market territory since 1948.
Last Friday, the stock market witnessed a substantial surge, causing the S&P 500 to come close to ending the longest bear market period since 1948. Investors are now pondering over the authenticity of this growth, wondering if it’s a genuine, long-term trend or a mere temporary fluctuation.
Last Friday, the S&P 500 index gained 61.35 points, reflecting a 1.5% growth, and concluded the day with a closing value of 4,282.37. This marks the highest closing level seen since August 18, 2022, as reported by Dow Jones Market Data. A close above 4,292.48 would signify a 20% surge from the closing low of 3,577.03 that was established during the bear-market on October 12, 2022. This achievement would satisfy the commonly used definition that indicates the conclusion of a bear market.
The rally on Friday was credited to three factors: a stronger-than-expected employment report for May, the resolution of the debt-ceiling debate, and expectations that the Federal Reserve will not increase interest rates at its upcoming policy meeting. Prior to Friday, the S&P 500 had been in a bear market state for 244 trading days, which is the longest period since May 15, 1948 when it lasted for 484 trading days. On average, bear markets have typically lasted for 142 trading days throughout history.

According to José Torres, a Senior Economist at Interactive Brokers, investors are hopeful that the debt-ceiling deal will be approved by President Biden this afternoon. Despite consistent job and wage growth in May, investors are paying attention to the rise in the unemployment rate that was reported in the morning’s Employment Situation Report. This news has still managed to increase optimism and positive sentiment among investors.
He stated that the slight increase is leading to predictions of the Federal Reserve taking a break at their scheduled meeting on June 14, with a probability of 72% in favor of that happening.
The CME FedWatch tool shows that traders in the fed-funds futures market have estimated a 31% chance of the central bank raising its benchmark interest rate by 0.25% at its policy meeting on June 13-14. This is an increase from 20.4% as of Thursday. At the beginning of the week, the market had predicted a 64% likelihood of a rate hike of 0.25%.
According to Quincy Krosby, who holds the position of chief global strategist at LPL Financial, the stock market experienced a “widespread” rally on Friday, which is exactly what the market had been hoping for. Many market analysts consider a narrow market leadership to be a missing piece of the puzzle when it comes to the recovery of the market.
The S&P 500 index has increased by 11.5% so far this year, and a significant part of the overall returns can be attributed to a few major technology companies such as NVIDIA Corp., Alphabet Inc., and Apple Inc. This surge in technology stocks is a result of recent investor confidence in artificial intelligence.
The index has not shown much growth this year, apart from a few well-known companies.
According to Dow Jones Market Data, the S&P 500, which is weighted by market capitalization, has outperformed the equal-weighted SP500EW by more than 10 percentage points in the year 2023. This is the largest margin of outperformance recorded year to date, while the SP500EW has seen a decline of 1% in the same period.
According to Krosby, the recent increase in technology stocks, which has been driving the S&P 500 and Nasdaq Composite, is now beginning to affect the wider market as shown by the significant rise in the Russell 2000, a small-cap index, on Friday. This suggests an optimistic outlook for the market as a whole.
According to data from Dow Jones Market, the Russell 2000 experienced its highest daily increase since November 10, 2022, with a jump of 3.6% on Friday.
Krosby spoke to MarketWatch on the phone and stated that for the rally to be considered genuine, it must not only be limited to the big tech companies. It must also be reflected in the wider market, particularly the Russell 2000, which has a strong correlation with problems in the credit markets and banks. This will affirm the validity of the current rally.
She stated that if only those five names were present, both investors and traders would be concerned about missing out, despite the fact that they would eventually participate. Nonetheless, the widespread rally that is currently happening is beneficial for the market’s atmosphere and investor mentality.
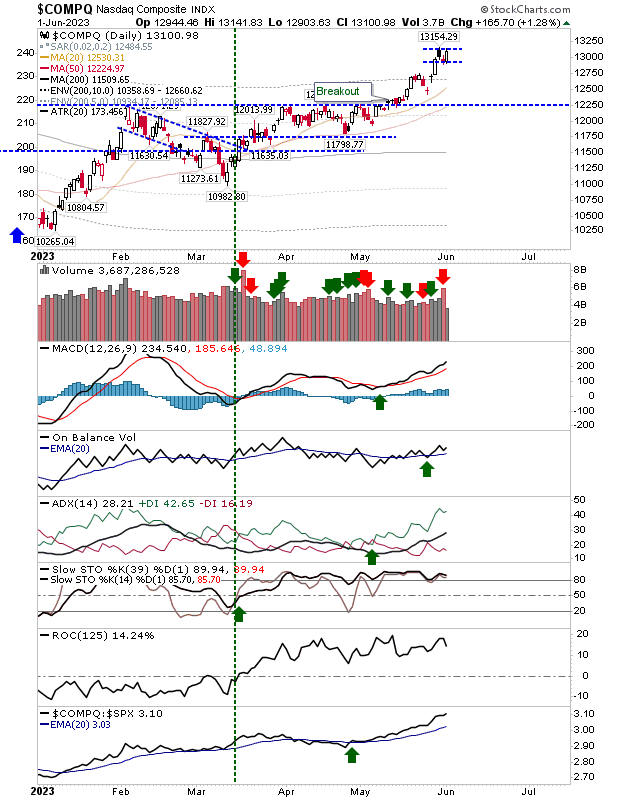
The DJIA rose by 2.1%, gaining more than 700 points, to a final value of 33,762.76, and the Nasdaq Composite increased by 1.1% to finish at 13,240.77.
It is advisable to be careful. Experts have pointed out that not every bear exit results in long-lasting bull markets.
Sam Stovall, the chief investment strategist at CFRA, pointed out in a note published in May that while the tech-heavy Nasdaq Composite experiences fake bear-market exits quite often, the S&P 500 is subjected to them much less frequently.
Stovall explained that out of the 14 bear markets that have occurred since World War II, only two of them had false bottoms. These two bear markets were the 2000-02 and 2007-09 periods. The 2000-02 episode had two instances of false bottoms while the 2007-09 period only had one.
The possibility of false signals is why not everyone agrees with the 20% rule. Some experts believe that a new bull market only starts when the old high is exceeded, whereas others have more intricate standards.


