Approaching 2022 Bull Market Highs: A Closer Look at Current Valuations
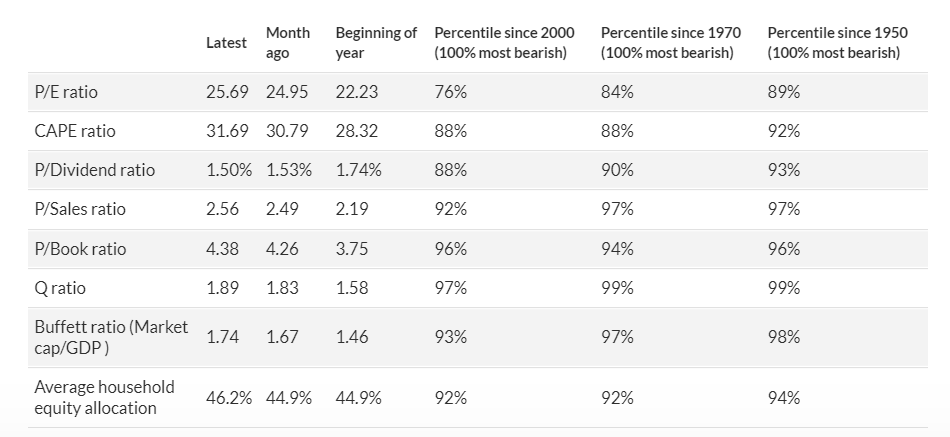
The U.S. stock market‘s valuation is inching closer to the lofty levels witnessed during the bull market peak in early 2022. This unmistakable observation comes from my monthly review of eight valuation models, which have historically shown remarkable accuracy in forecasting subsequent returns for the U.S. market.
Although these eight theoretical approaches differ in nature, they collectively paint a similar picture of the U.S. market’s current state. This wide array of approaches is crucial, as individual indicators can be criticized for their limitations. For instance, price/book and q-ratios are affected by the inadequate GAAP accounting of intangible assets, and evaluating the dividend yield doesn’t fully account for the growing trend of corporations returning cash to shareholders through share repurchases rather than dividends.
To dismiss the bearish signals from all eight indicators, the bulls would have to demonstrate that each indicator is flawed. While that is theoretically possible, it becomes a more challenging and less plausible argument to make.
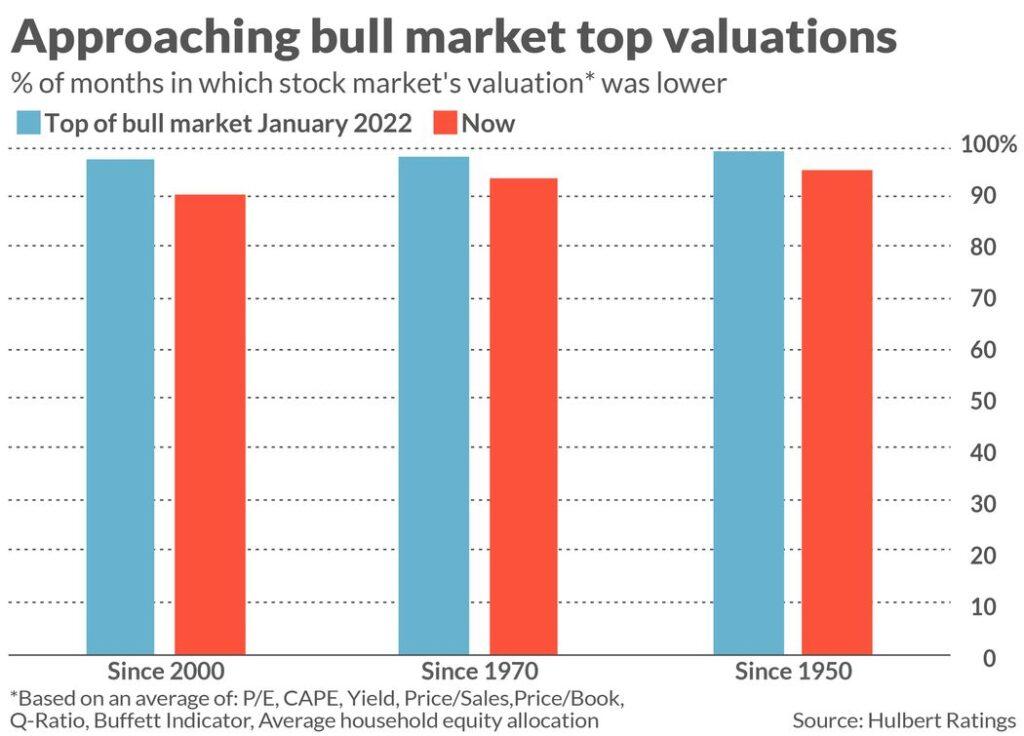
The chart below compares the S&P 500’s current valuation with the levels observed at the peak of the bull market in early January 2022. The columns represent the percentage of past months when valuations were lower, with higher columns indicating higher relative valuations.
Regardless of the comparison period – whether going back to 2000, 1970, or 1950 – the message remains consistent: U.S. stocks are currently nearly as overvalued as they were at the peak of the previous bull market.

This raises concerns, as bear markets are expected to bring valuations down significantly, providing a more solid foundation for the next bull market to soar even higher. However, this most recent bear market defied expectations, as we have not yet returned to the valuation levels seen at the early-2022 peak, yet today’s S&P 500 valuation is still highly stretched.
Valuation Models and Their Predictive Abilities
For the bulls, the only solace among these valuation indicators might be that they offer little insight into the market’s short-term direction. Valuation’s predictive ability lies on a much longer horizon, typically spanning five to ten years. Therefore, it is entirely plausible for stocks to continue rising in the coming months despite market overvaluation. However, if this occurs, the S&P 500 will rest on an even shakier foundation than it currently does.


