In the current market climate, the S&P 500 is treading carefully towards significant support levels, with the energy sector poised to take the reins as technology momentum falters. These observations come from Jonathan Krinsky, the chief market technician at BTIG, who shared his insights with clients in a recent weekend note.
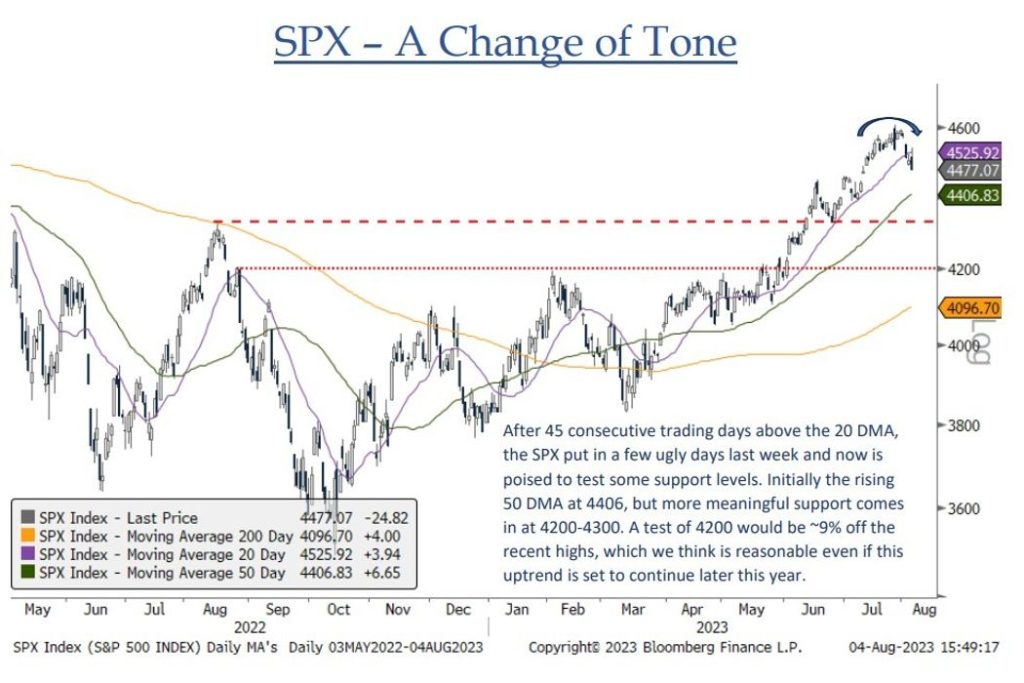
Krinsky noted that Apple, a key player with a 7% weighting in the S&P 500, has broken its uptrend, signaling a shift in dynamics. The S&P 500, which had enjoyed 45 consecutive trading days above the 20-day moving average, experienced a turbulent period last week, raising the possibility of testing crucial support levels. Initial attention is on the rising 50-day moving average (DMA) at 4406, but the more significant support lies within the range of 4200-4300, according to Krinsky.
Should the market pull back to the 4200 level, this would represent an approximate 9% decline from recent highs. Krinsky maintained that such a retreat could be reasonable, even if the broader uptrend continues later in the year.

Krinsky’s caution extended to the Nasdaq, which has been powered by its prominent tech components, driving the market’s impressive nearly 17% year-to-date gain. He highlighted concerns about weakening momentum, especially evident in the Invesco QQQ exchange-traded fund (QQQ), which tracks the Nasdaq 100. Despite a rare six-month winning streak, the QQQ retreated last week, breaking its uptrend and signaling a potential shift in trajectory.
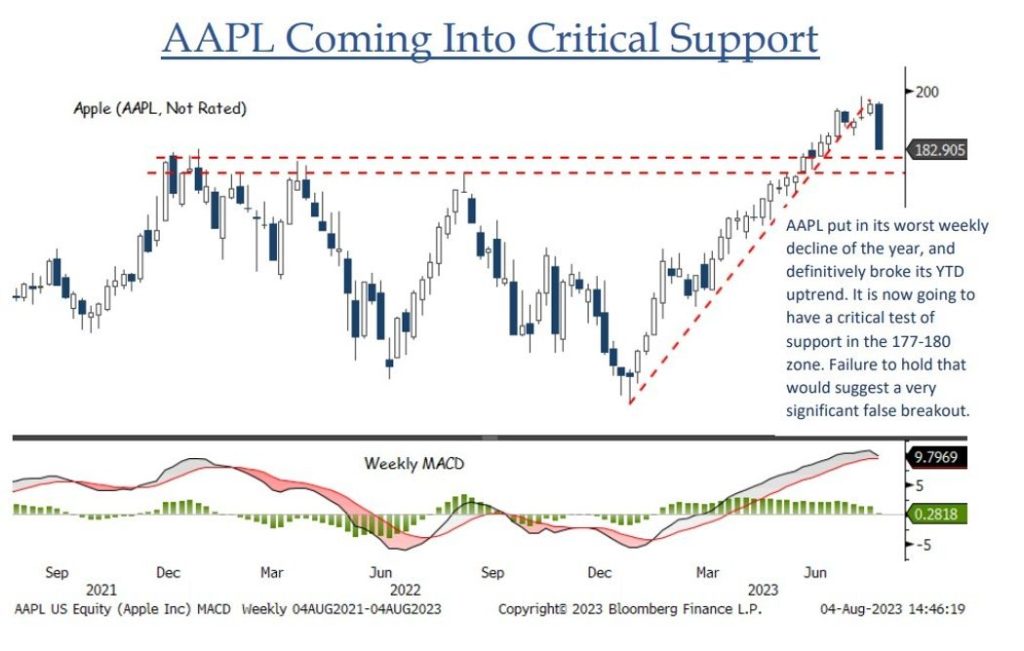
Of particular note was the recent downturn in Apple, the largest company by market value. Krinsky remarked that Apple faced its most significant weekly decline of the year and unmistakably broke its year-to-date uptrend. The company now confronts a critical support test within the 177-180 range. Krinsky suggested that failure to hold this range could indicate a substantial false breakout.
Despite the challenges faced by some major tech players, a glimmer of hope emerges from another sector.

Krinsky pointed out that the energy sector, which has remained relatively flat year-to-date, is showing signs of potential momentum. The weekly MACD (Moving Average Convergence Divergence), a trend-following momentum indicator, has shifted to a buy signal. This transformation suggests a favorable setup for the energy sector, with the Energy Select Sector SPDR ETF (XLE) breaking its year-to-date downtrend and the SPDR S&P Oil & Gas Exploration & Production ETF (XOP) also experiencing a breakout.
As the market landscape evolves, the S&P 500 faces a critical juncture, and all eyes turn to the energy sector’s emerging potential. The intricate dance of market forces continues, and investors prepare to navigate the shifting currents ahead.


