S&P 500 and Dow Post First Monthly Losses Since April
The Dow and S&P 500 closed October in the red, marking their first monthly losses since April as Halloween dealt investors more tricks than treats. A tech-driven selloff on Thursday dragged down the S&P 500, while the Nasdaq Composite recorded its largest single-day decline since early September. Analysts attributed the dip to various unsettling factors, […]
Can Stocks Rise Until Inauguration? It Depends on the Election
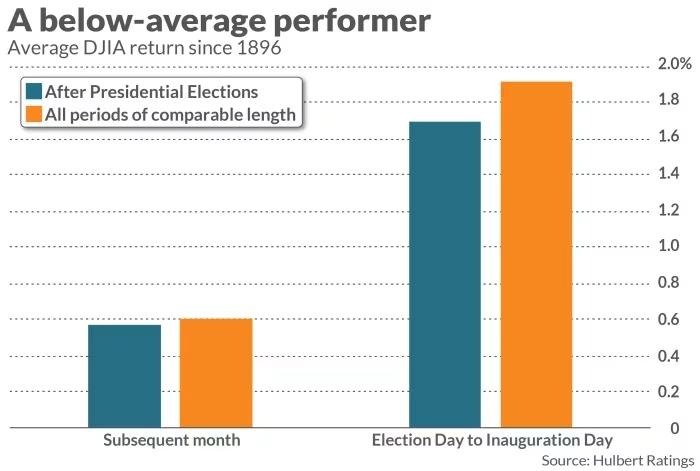
Historically, the stock market tends to perform better when the incumbent political party wins a U.S. presidential election, while declines are more common when it doesn’t. Data shows that between Election Day and Inauguration Day, the Dow Jones Industrial Average has averaged a 4.4% gain when the incumbent party wins, compared to a 2.0% decline […]
Can the S&P 500 Rally Keep Going?
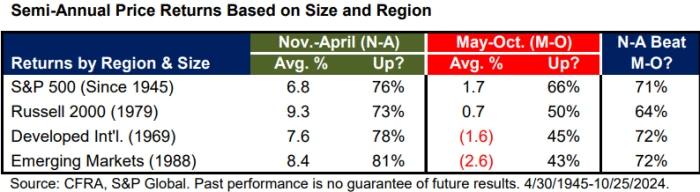
The U.S. stock market is approaching what has historically been its strongest six-month stretch, from November through April, despite skipping the traditional “sell in May and go away” dip. Investors, however, remain cautious, wondering if the rally can maintain its momentum amid rising Treasury yields and concerns over the upcoming presidential election. Historically, the November-to-April […]
Election Clarity Could Spark Market Surge, Says Griffin

Ken Griffin, CEO of Citadel, believes markets will likely rally once the uncertainty surrounding the upcoming U.S. election dissipates. Speaking at the Future Investment Initiative (FII) conference in Saudi Arabia, Griffin said, “The reduction in uncertainty is almost always positive for asset prices.” He noted that the current political climate, with Trump slightly favored but […]
Election Jitters: How Investors Are Reacting

For most of 2024, stock-market investors appeared unfazed by the prospect of either Donald Trump or Kamala Harris taking the White House. However, election jitters have finally begun to rattle equities, with less than two weeks to go before Election Day. This week, a sharp climb in Treasury yields, driven by the surge since September, […]
Trader Optimism Returns to Pre-Drop Levels
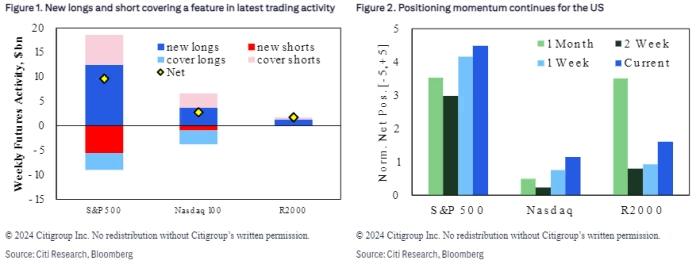
Citigroup strategists are growing cautious about the stock market’s current enthusiasm, although they aren’t advising investors to reduce their positions just yet. According to Citi’s team, led by Chris Montagu, global head of quantitative research, net-long positioning in S&P 500 futures has reached its highest point since July 2023. Back then, this overly bullish positioning […]

