Three Factors That Could Trigger a Third Wave in Market Pullback

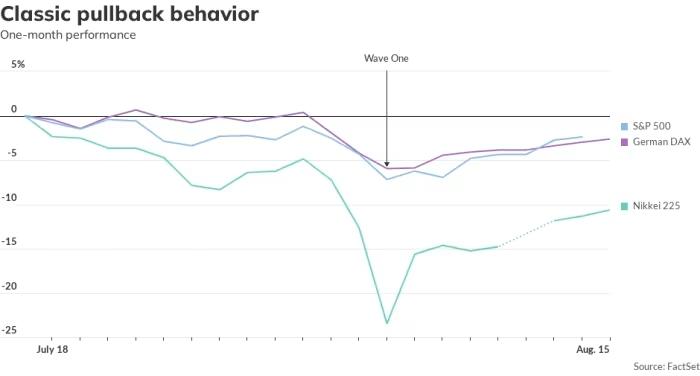
The S&P 500, Germany’s DAX, and Japan’s Nikkei 225 have all rebounded from their early August lows. According to Christopher Watling, CEO and chief market strategist at Longview Economics, this is typical pullback behavior. He explains that most pullbacks follow a three-wave pattern: an initial selloff, a relief rally that retraces some losses, and then […]
August Blues: Why the Bull Market is Far from Over

“A challenging start for stocks in August doesn’t necessarily signal a deeper market downturn, according to Angelo Kourkafas, senior investment strategist at Edward Jones. July’s inflation data, highlighted by the producer-price index, revealed a 2.2% year-over-year rise in wholesale prices, down from June’s 2.7%. ‘Market are reacting positively to this,’ Kourkafas noted. ‘Yields have fallen, […]
Why the ABC Method is Essential for Effective Day Trading

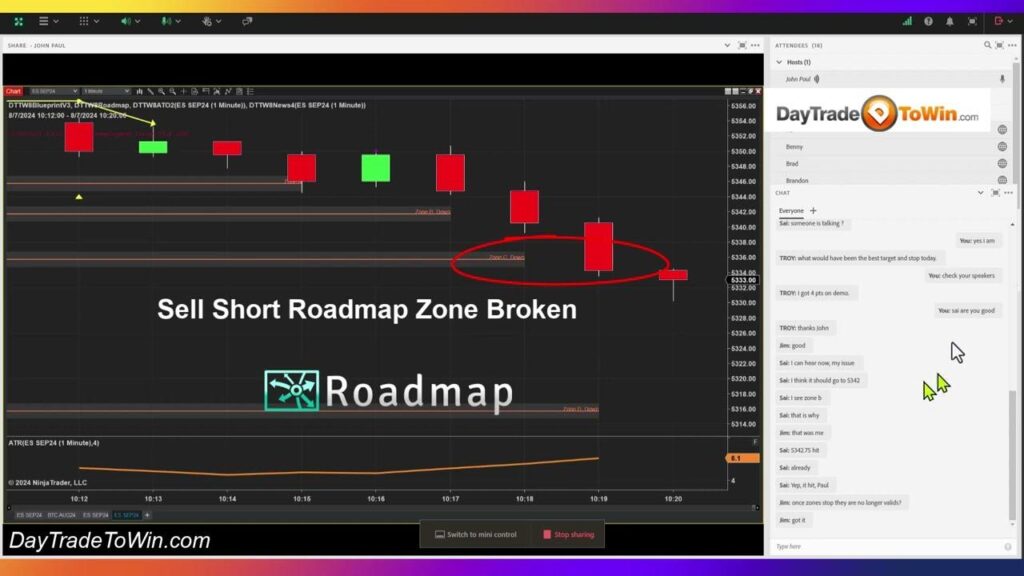
In day trading, having a clear and strategic method is key to making informed decisions. One such approach is the ABC method, which helps traders identify potential trends and reversal points within the market. This post will break down how the ABC method works, particularly focusing on how to interpret and react when a zone […]
Post-Volatility Market: Lessons from History

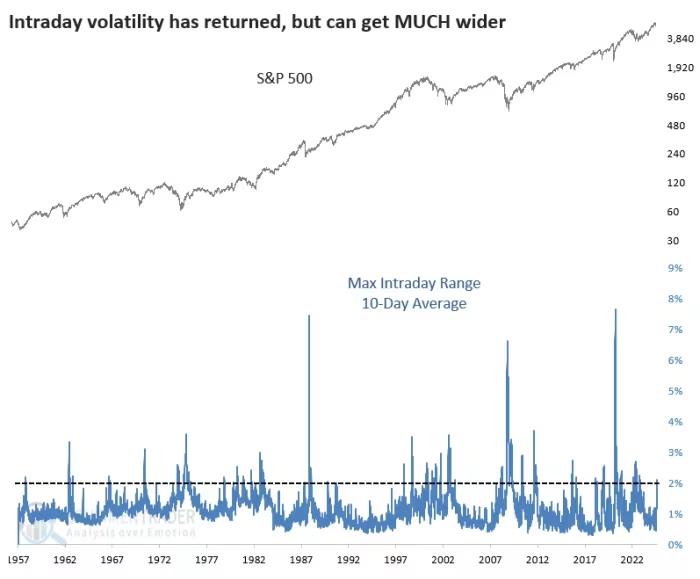
The recent turbulence in the U.S. stock market has reminded investors of the volatility that had been absent during a long period of calm, potentially signaling a significant shift in market sentiment, according to Jason Goepfert, founder and senior research analyst at SentimenTrader. Over the past two weeks, the S&P 500 index experienced significant intraday […]
Blueprint V3 Update: Boost Your Trading Accuracy!

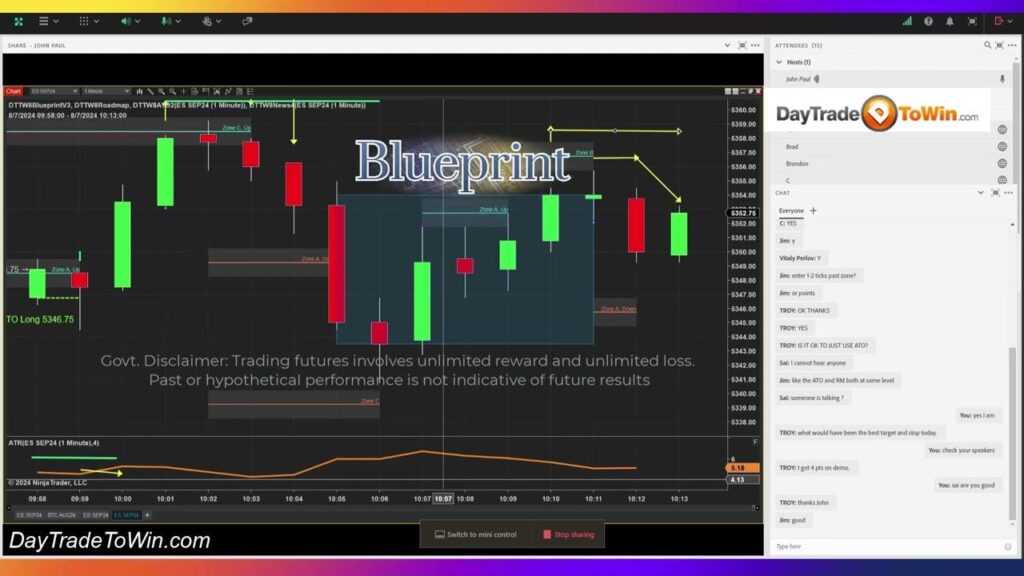
Welcome traders! If you’ve been following the Blueprint trading system, you’ll be excited to know that version 3 is now available. In this update, we’ve incorporated some highly requested features and enhancements, designed to provide more precision and flexibility in your trading strategies. Whether you’re a minute-by-minute day trader or a long-term swing trader, Blueprint […]
U.S. Stocks Face Hurdles with Inflation and Earnings in Focus

This week’s main focus for the stock market will be Wednesday’s inflation report, which comes amid a busy period that also includes earnings from major retailers and a retail sales update. Wall Street is growing increasingly anxious about the U.S. economy, with concerns that American households are feeling the strain. If this is reflected in […]


