September 2024 Sonic Trading Videos #2
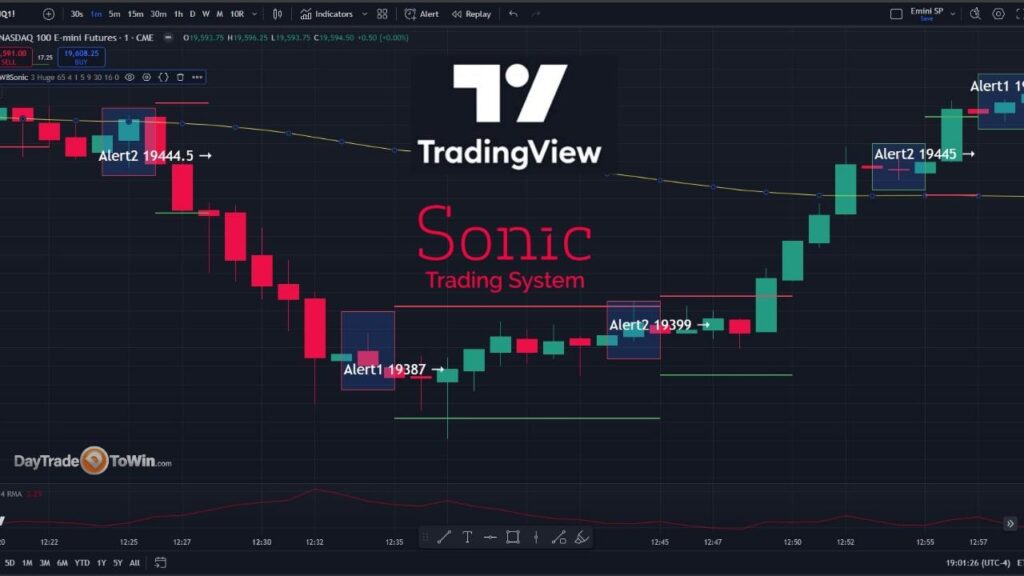
Hello, Traders! Today, I will share with you the latest Sonic Trading System, specifically focusing on limiting risk, trading in the afternoon, and Friday trading. Available for Ninja Trader and TradingView, Video 1 – Don’t Rush into Trades – Do This To Limit Risky Trades Video 2 – Sonic Trading System: Afternoon Success! 🌟 Video 3 […]
Sonic Trading System: High Accuracy Intraday Strategy
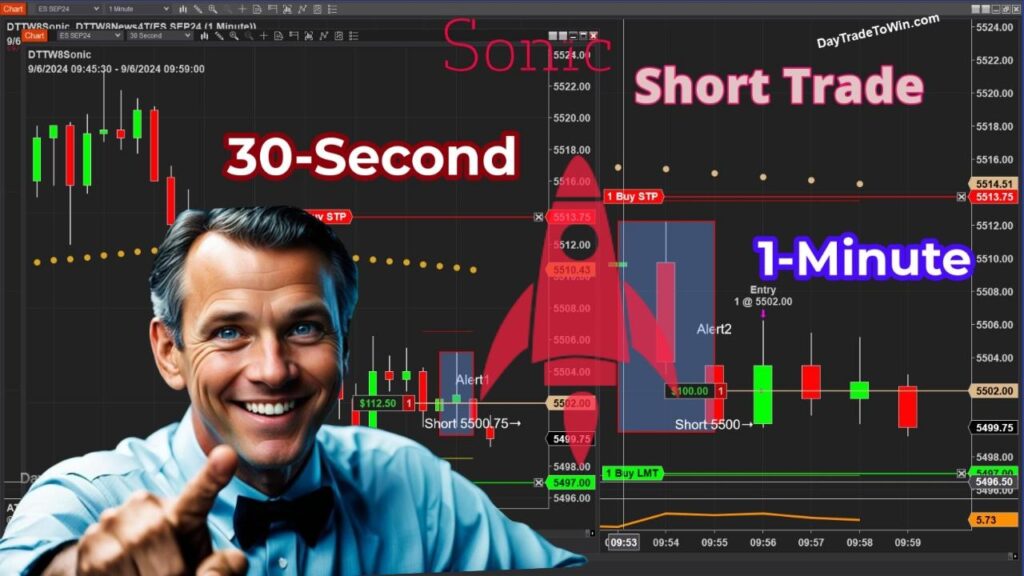
In this post, we delve into a live trading session using the Sonic Trading System, a method focused on price action. Our trader walks us through a real-time Friday morning trade at 9:54 AM, providing insights into navigating the market using this hybrid system. Introduction to the Sonic Trading System The Sonic Trading System is […]
Boost Your Profits with Sonic Signals
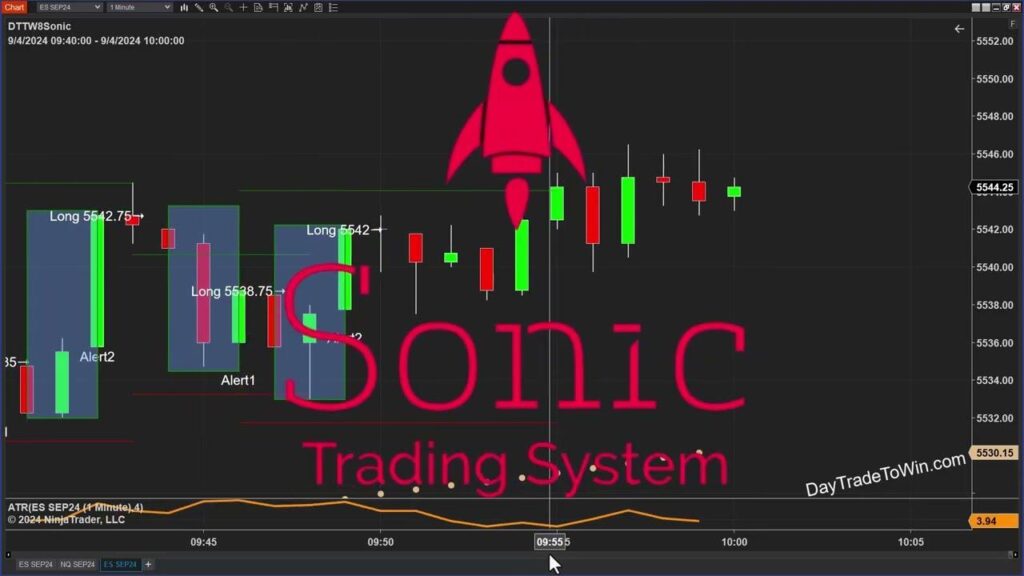
Hello traders! Today, we’re diving into the Sonic Trading System, a powerful tool for navigating the market with precision. Not only will we explore its signals, but I’ll also share key insights into how news events can impact your trades and how to handle these situations like a pro. The Sonic Trading System in Action […]
1 Hour Trading Sonic – All Trades
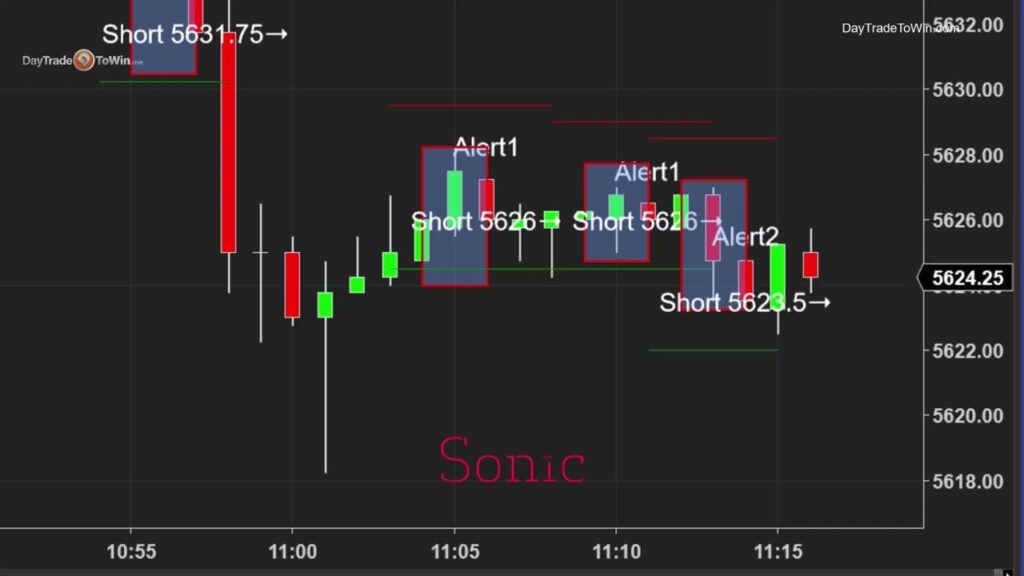
Hello Traders! Today, we’re diving deep into the Sonic Trading System with an exciting review of one hour’s worth of trades. We’ll analyze all the action that took place between 11:00 AM and 12:00 PM on Friday, August 30th. If you’re curious about what this system can do, or if you have any questions, feel […]
Sonic Trading System Videos

Hello, Traders! Today, I will share with you the latest Sonic Trading System, specifically focusing on adjusting targets to optimize your trading strategy. Whether you’re a seasoned pro or just starting, understanding how to tweak these settings can significantly impact your trading outcomes. Video 1 – Introducing the Sonic System Video 2 – Sonic Trading System […]
Sonic Trading System Dynamic Profit Targets
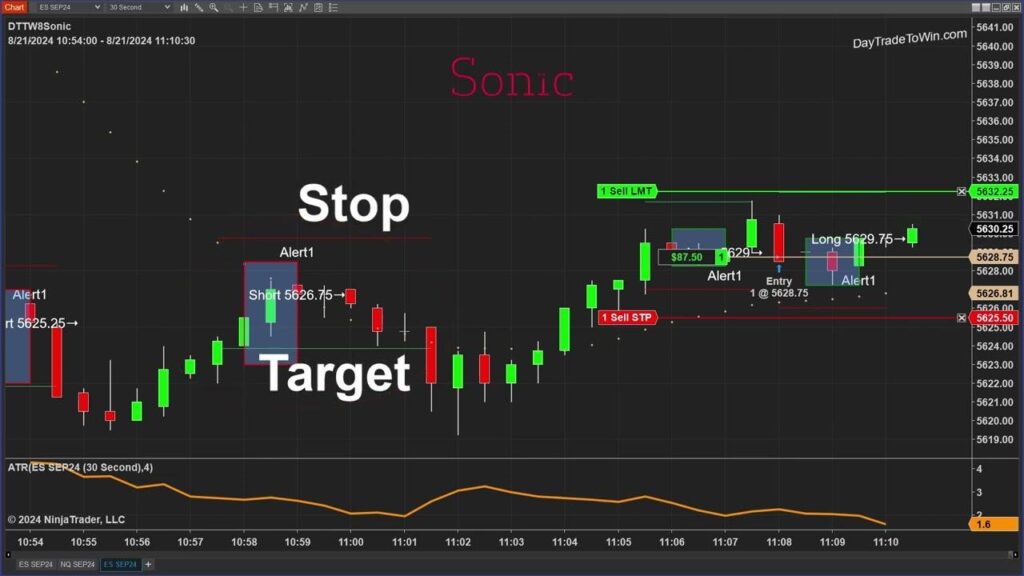
Traders, let’s dive into the Sonic Trading System and uncover the intricacies of this powerful tool. If you’re looking to fine-tune your trading strategy, understanding the flexibility and adaptability of the Sonic system is essential. The Power of Dynamic Targets and Stops One of the most critical aspects of the Sonic Trading System is its […]


