Mentorship Student Najam Gives Trading Education Opinion

“Right now, I am trading a few hours a day, two contracts, with an average of four points a day. My goal is to trade 10 contracts in the near future.” » Improve Your Trading Today « Najam from New Jersey was a struggling trader who traded on and off for about a year. During […]
Euro Financial Crisis Can’t Calm E-mini S&P for Long
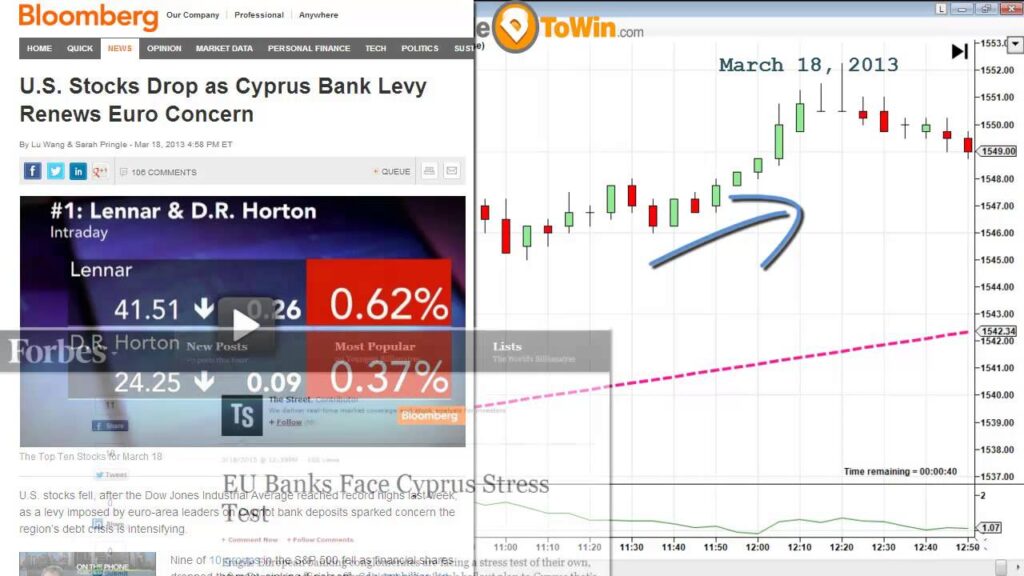
» Get the Atlas Line Signals « On March 18, 2013 the market gapped down overnight due to news in the country of Cypress. Take a look at the E-mini S&P at around midnight, US/Eastern and you’ll see the gap. The news was that the Cypress government is assuming control of its citizens’ financial assets. […]
Four Days of Atlas Line Trades Reviewed
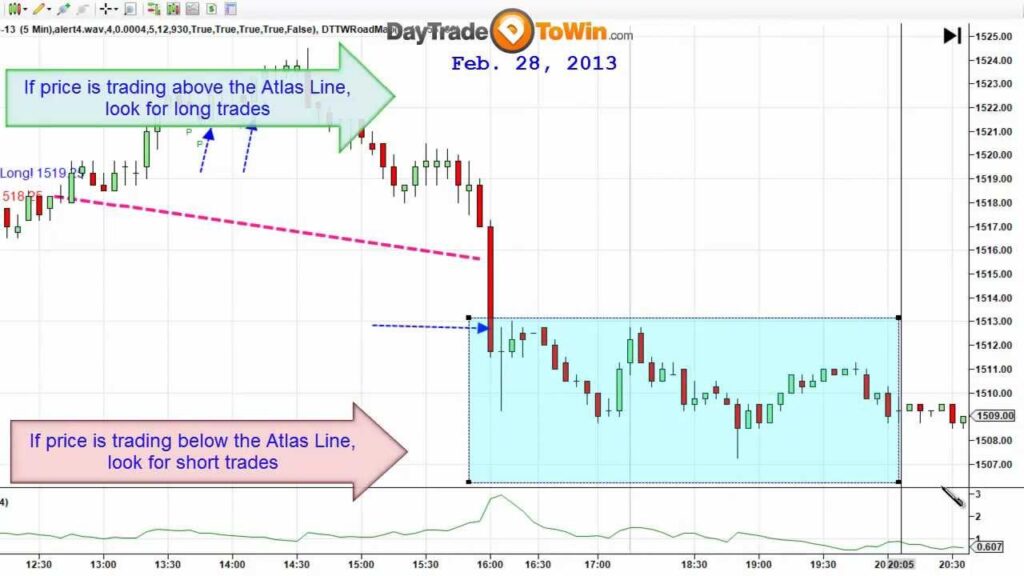
Last week, John Paul took a look at the E-mini S&P and the Atlas Line. He scrolled through four days of history, showing the many signals produced by the software. You can see more recent trades here. The idea of the Atlas Line is to provide you an exact entry and an overall direction of […]
How to Find the Trend in Any Market
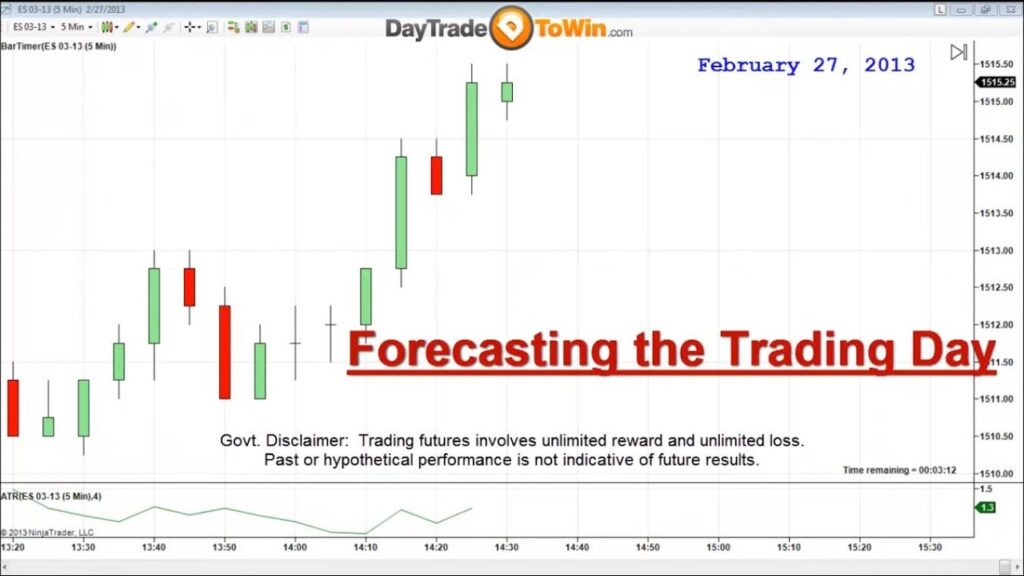
Watch this video to learn a great forecasting technique. It will help you determine whether the day will be trending (heading in one direction for the most part) or whipsaw (full of choppy, difficult to trade, back and forth activity). The E-mini S&P 500 (ES) experienced a trending day on February 27, 2013. At 1:17 […]
Atlas Line Results for January 2013
Only a monthly basis, we like to report how well the Atlas Line has performed. January 2013 was another successful month as indicated by these totals… January, 2013 Total # of trades = 54 Total # of days traded = 21 Total net profit or loss (using 10 contracts excl. fees, slippage, etc.) = +$11,875 […]
Why Exact Entries and Exits are Important
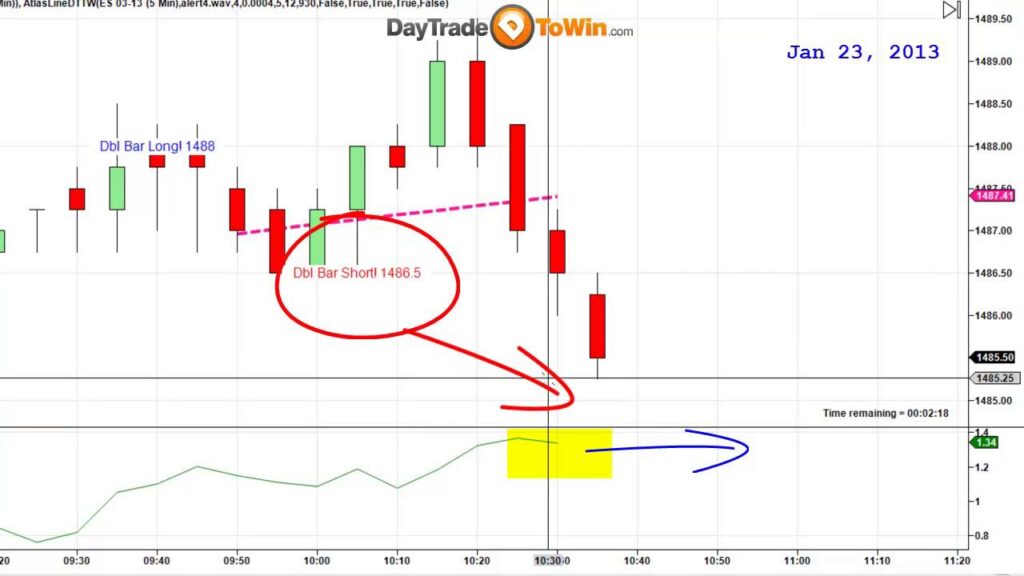
» Get the Atlas Line Signals « Questions? Contact us at support@daytradetowin.com or call us at 888-607-0008. On January 23, 2013 trading the E-mini S&P 500, the Atlas Line produced a successful Long trade at 1488. This first trade was good for one point according to the market’s ATR (Average True Range). Profit targets are […]
How to Filter Out Overbought or Oversold Conditions
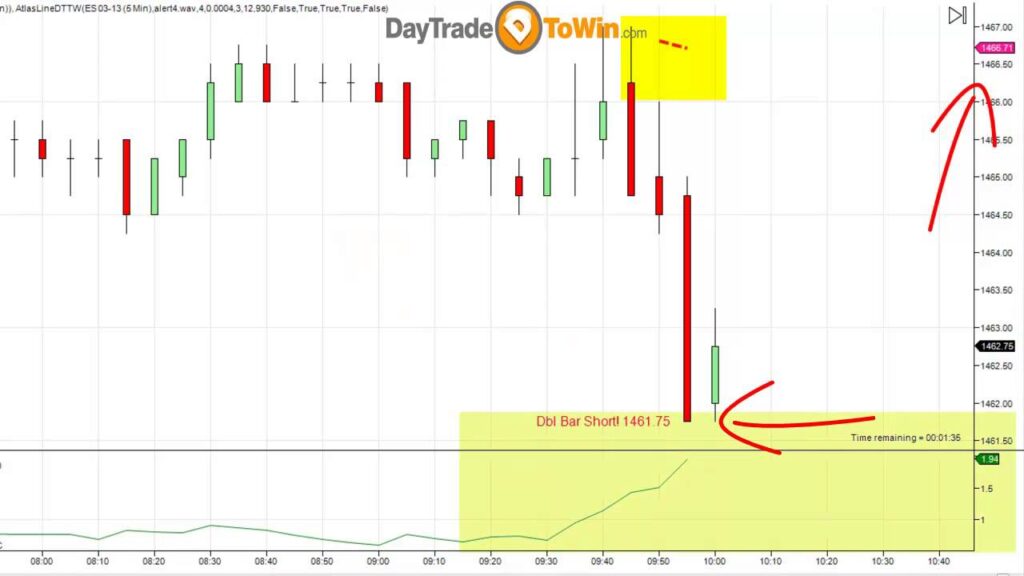
Ever see a candle suddenly plot that is much longer than the others? Of course you have – and a loss may have resulted. These candles often indicate the market is exhausted. After a candle of exhausion, you’ll probably see retracement or “confused” movement. As you can imagine, such market behavior pokes holes into many […]
Stop Losses, Profit Targets and Live Charts
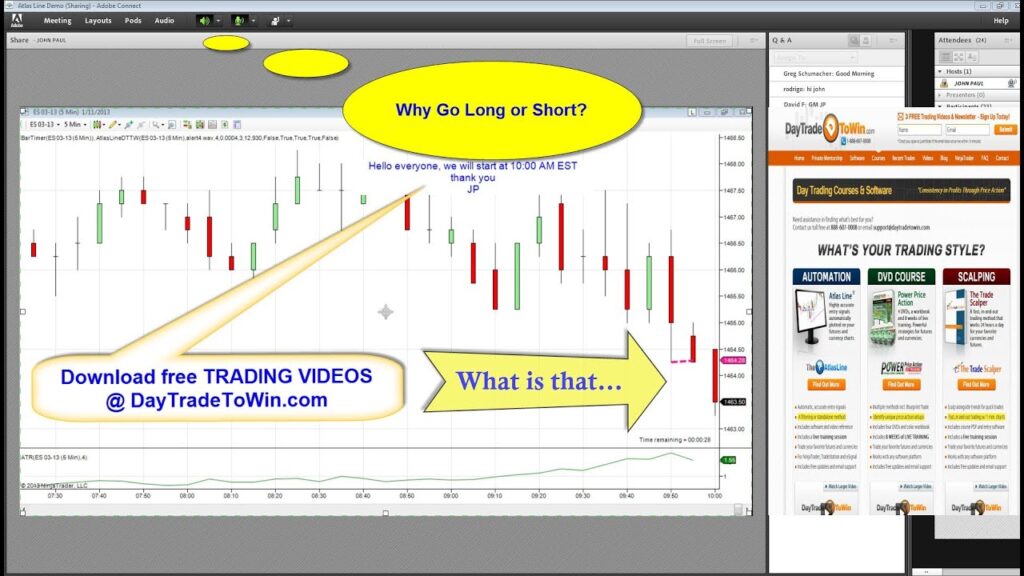
Recorded last week, John Paul pulls up his charts, shows off the Atlas Line and provides valuable information to beginner traders. Here’s a list of the highlights: – 2:00 – Why most indicators will not be helpful to your trading – 6:00 – Three stop strategies we like to use – 23:00 – Best markets […]
Atlas Line Results – 4 Months Worth
The last time we calculated our Atlas Line monthly results was back in August 2012. Let’s take a look at September through December, 2012. Remember, past performance is not indicative of future results. There is substantial risk of loss in day trading. Data used is from the Recent Trades page. Calculations were performed manually – […]
Atlas Line Live Webinar from Dec. 21, 2012
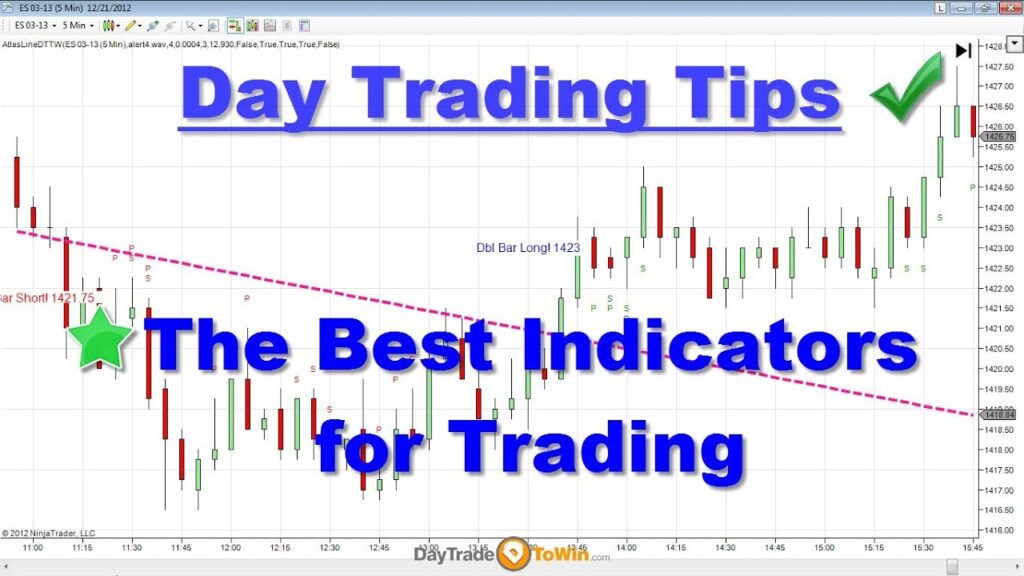
Here is the long-awaited webinar presentation from last Friday (December 21, 2012). John Paul demonstrates the Atlas Line live across a variety of charts, explaining how this indicator can be used to identify trends. By knowing the direction of the market in advance, you can position trades long or short ahead of time. Entry prices […]


