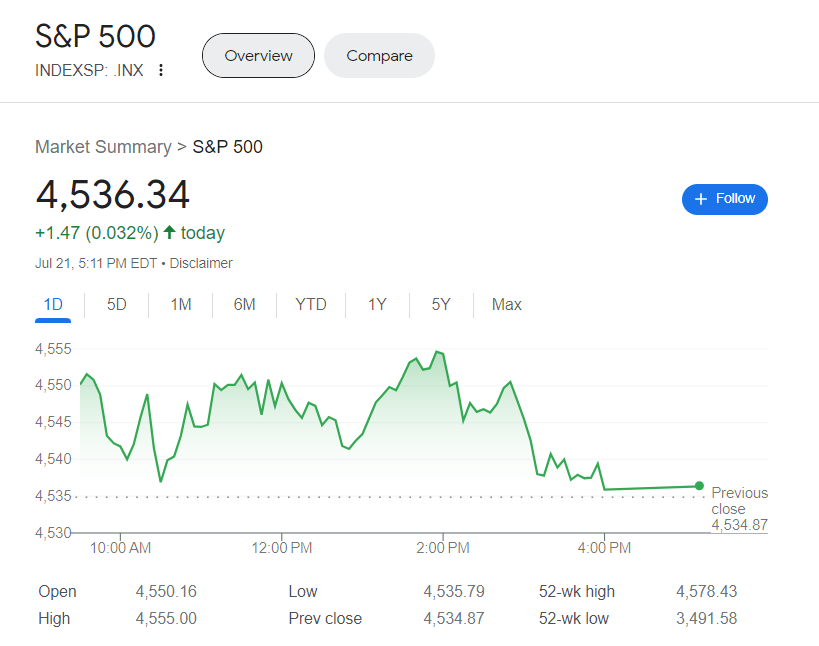
A 2023 surge in the stock market driven by prominent tech companies has triggered concerns that another bubble could be forming, as the Nasdaq Composite index is noticeably surging ahead of the S&P 500’s robust gains.
Jessica Rabe, co-founder of DataTrek Research, in a note on Thursday, suggests that a longer-term view of market trends might indicate that the Nasdaq is simply aligning itself with the large-cap U.S. benchmark. She also cautioned not to overlook how challenging the year 2022 was for the stock market.
Rabe noted that the Nasdaq had risen by 37.2% since the beginning of the year through Wednesday’s close, greatly surpassing the S&P 500’s 18.9% increase. However, over the past three years, the S&P 500 had experienced a 42% increase, which is more than the Nasdaq’s 37% rise.
DataTrek conducted an analysis of the rolling returns over a three-year period for both the S&P 500 and the Nasdaq Composite over the past half-century, to put the losses in 2022 and the predicted rebounds in 2023 into perspective. Rabe stated that the selected timescales were chosen due to a three-year term evening out the yearly volatility and seasonality, and fifty years providing a diverse snapshot of business, interest rate, and valuation cycles (refer to the chart below).
Rabe mentioned that the Nasdaq Composite usually outshines the S&P 500 over a three-year span, despite being more unpredictable as anticipated. He further cited historical data from 1974, where the Nasdaq’s three-year average price return stood at 41.%, compared to the S&P 500’s 29%.

Over the past three years, the Nasdaq Composite has risen by 37.1%, compared to a 42% increase in the S&P 500. This makes the current year’s performance seem like it’s returning to the longer-term average.
The analyst explained that the Nasdaq has lagged behind the S&P by nearly 500 basis points in the past three years, a period during which the Comp usually surpasses it by a considerable amount (+1,220 bps). As a result, it’s logical for the Nasdaq to be making strides to recover and return to form in 2023.
The information also indicates that 3-year yields seldom project a loss and usually follow patterns akin to former cycles. She emphasized that, in the absence of a geopolitical or financial upheaval, both the Nasdaq and S&P characteristically yield positive returns, often in two digits, over a span of three years.
Despite the strong rallies in the Nasdaq and S&P this year, their three-year returns are modest in relation to historical standards, according to Rabe. The Nasdaq’s return of 37.1% over the past three years is a bit lower than its 41.2% average, however it’s still within one standard deviation on the lower side. On the other hand, the S&P 500 outperformed its 29% average with a 42% return over the same time frame, still remaining within an acceptable standard deviation on the higher side, Rabe added.
What is the ultimate implication? Rabe conceded that stock evaluations are high, implying that companies must persist in generating returns. However, she also emphasized that the remarkable surge of both indices can be partially attributed to a regression to historic averages. Rabe pointed out that the 2022 showings of the S&P 500 and Nasdaq were virtually equal to, or just as poor as those observed in the duration of the 1973-74 oil crisis and economic downturn; the era coinciding with the dot-com bubble burst; the preliminaries to the second Gulf War; and the 2007-09 financial meltdown.
“She stated that the gains made this year have brought them closer to their average returns over the past three years, but they are still far from reaching a bubble-like state.”


