
Don’t Give Back Your Profits: How to Trade Smart
The Real Goal of Trading Isn’t Just Making Money Most

Day Trading All-Time Highs with Structured Signals (TradingView + NinjaTrader)
In today’s market, we’re seeing something traders wait for —

Wait 5–10 Minutes After Market Open? Here’s Why It Matters for Day Trading
Introduction The first few minutes after the market opens can

Stock PDT – Pattern Day Trader Rule Change: $25,000 Down to $2,000 – What Traders Need to Know
Get the FULL PDT Trading Rule For small stock trading
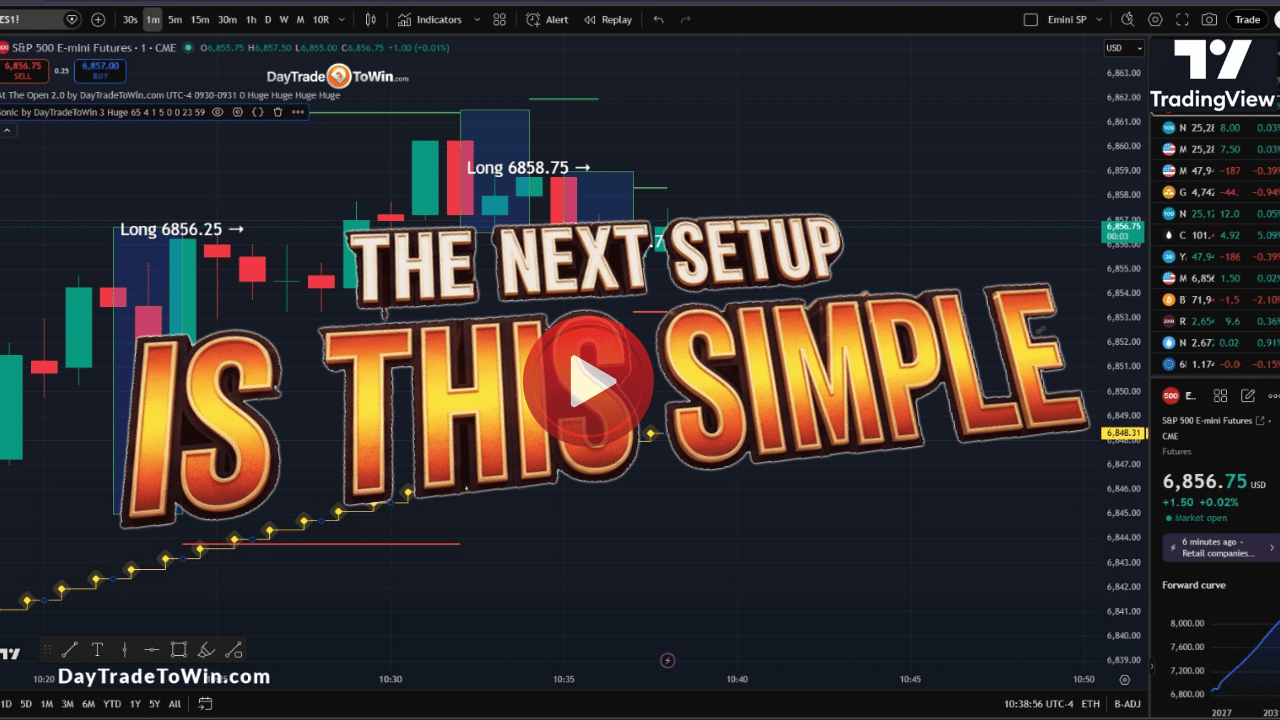
The Next Setup is This Simple
Many traders believe that when the market slows down, there
How to Day Trade Stocks (Confirmation-Based Strategy That Works)
How to Day Trade Stocks Using Confirmation Day trading stocks
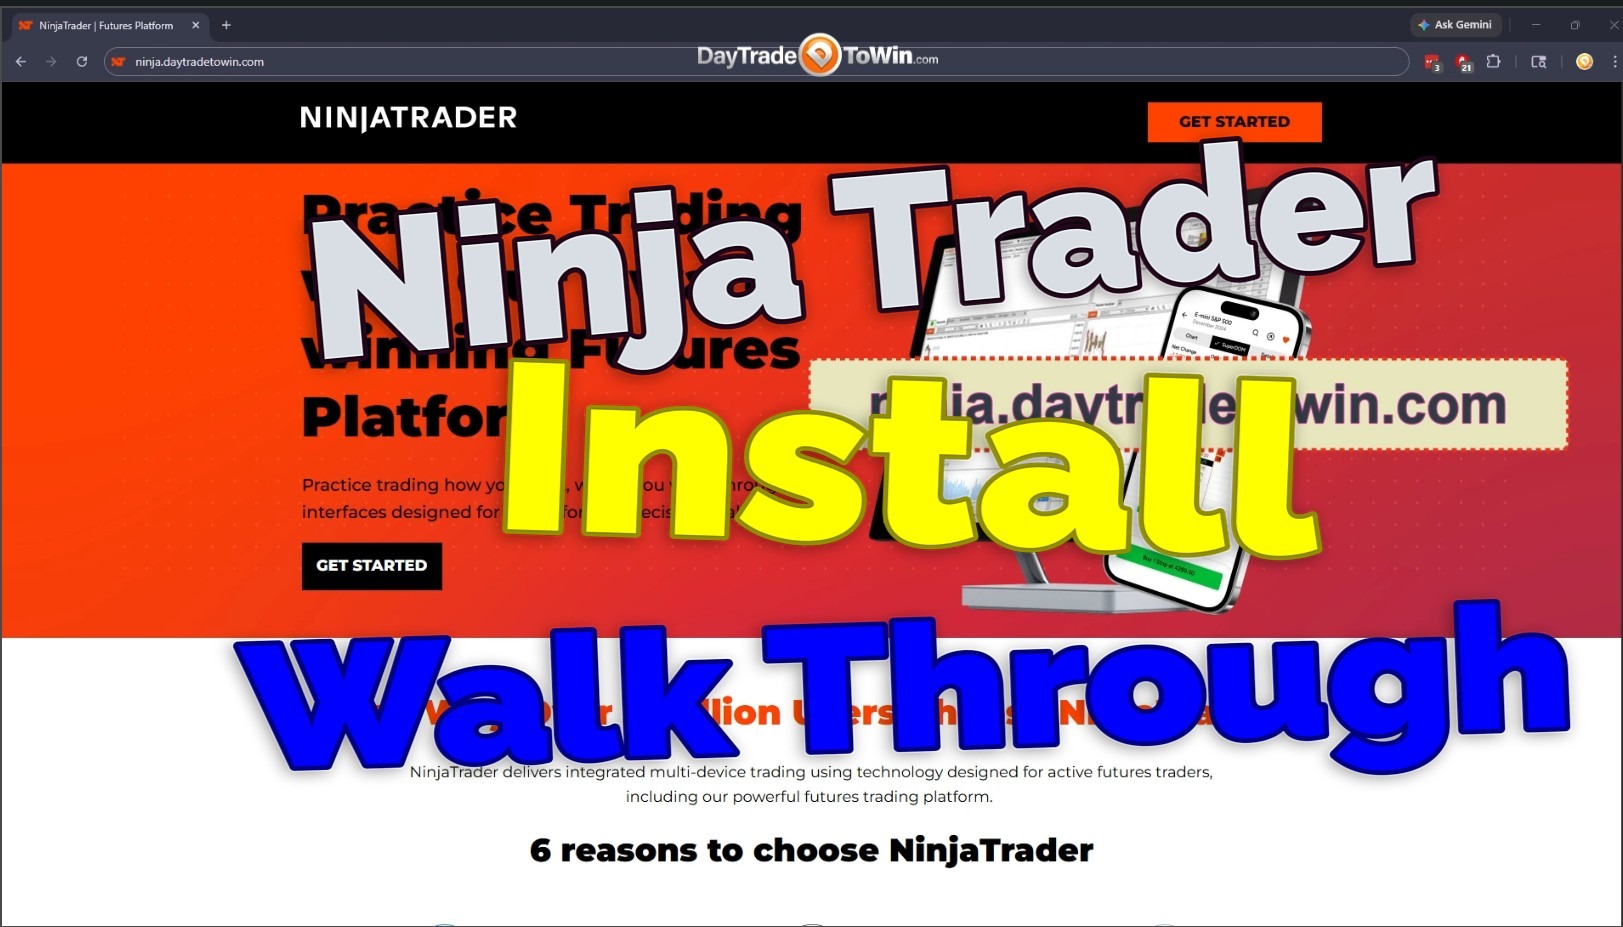
NinjaTrader Tutorial for Beginners: Step-by-Step Setup + FREE Live Data + Chart Setup Guide
🚀 NinjaTrader Tutorial for Beginners (Complete Setup Guide) Getting started
How to Trade Consolidation Breakouts Using Price Action (Blueprint Strategy Explained)
🚀 Why Most Traders Struggle in Sideways Markets One of

How to Add DayTradeToWin Indicators on TradingView (Full Setup Guide)
In this guide, we’ll walk through how to add DayTradeToWin
4 Sonic Signals → $750 Trade (Micro E-mini Futures Strategy Explained)
In today’s Sonic Monday session (March 23, 2026), the market
Day Trading Breakdown: MES, MNQ & MCL Signals in Action Using Price Action Software
Day Trading Breakdown: Signals in Action Across MES, MNQ, and

Trading both sides of the market → Market Reversal → Long + Short Profits (Trade Management Explained)
4 Long Signals → Market Reversal → Short Profits In
