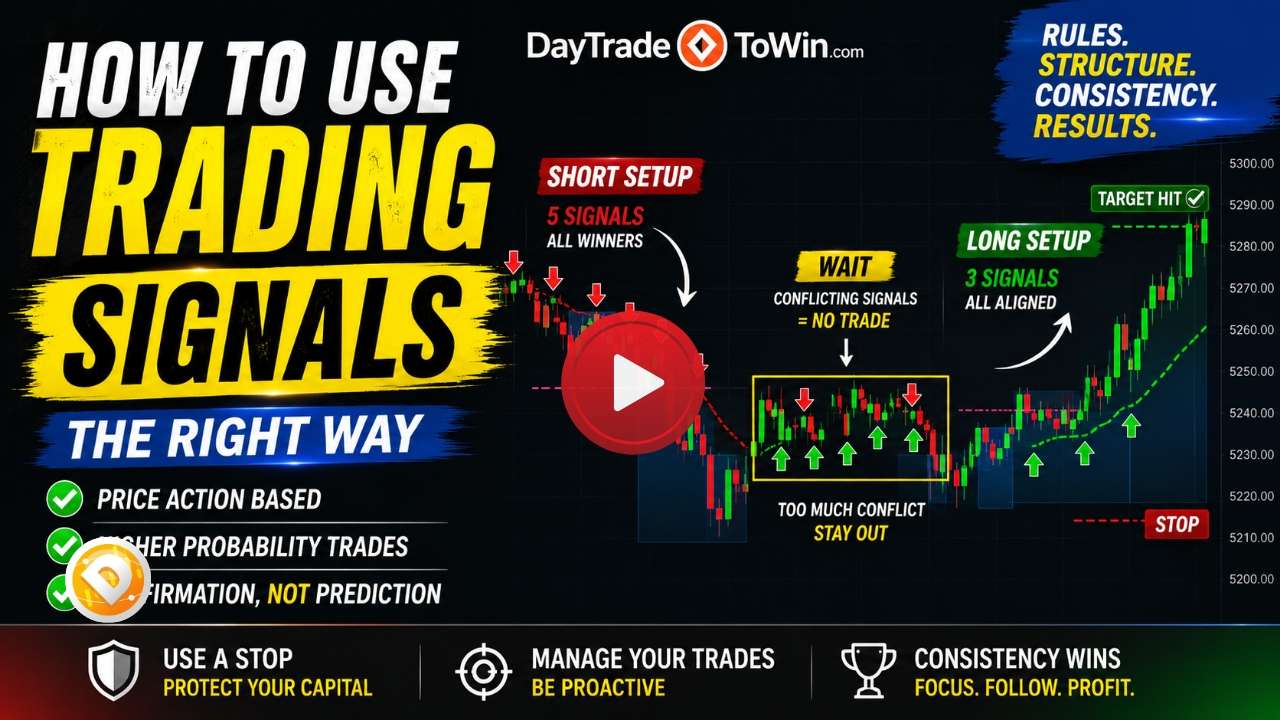
How to Use Trading Signals Correctly for Day Trading | Price Action & Confirmation
Many traders struggle with one important concept: Not every trading

S&P 500 Prediction: Why 7,500 Could Trigger a Major Market Reversal
The stock market continues pushing higher, and traders everywhere are
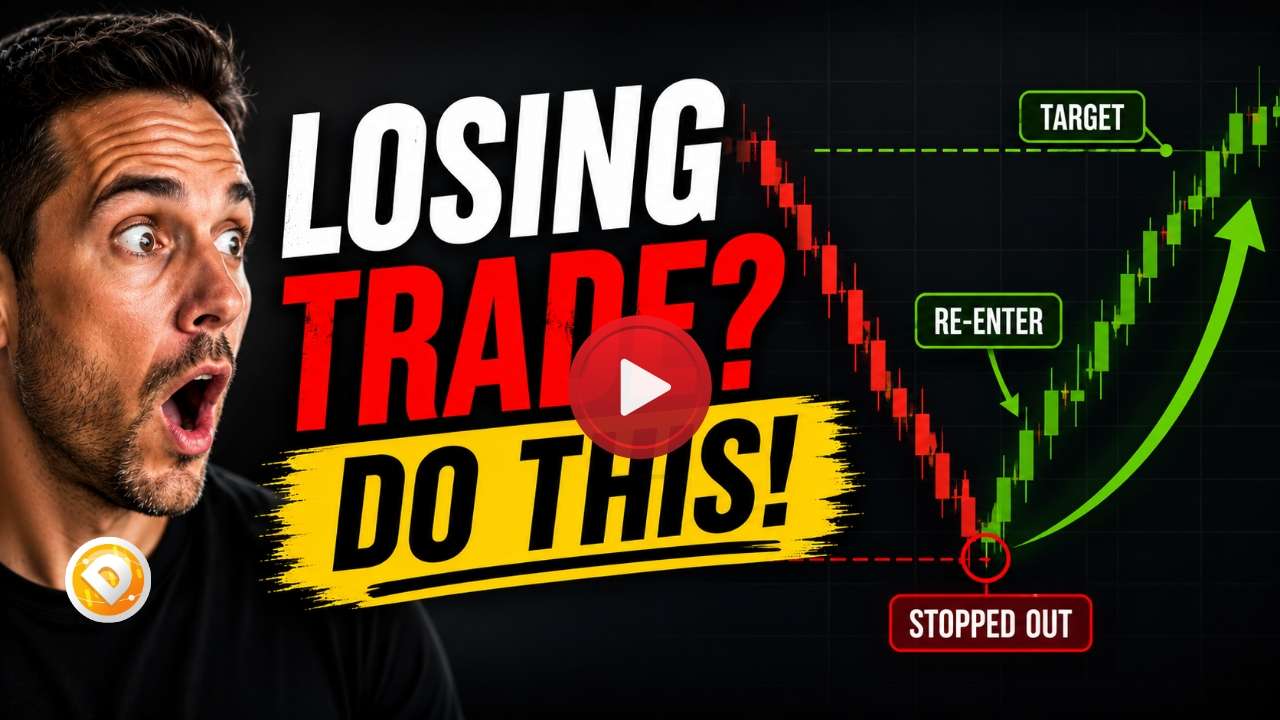
How to Recover From a Losing Trade Without Revenge Trading
Losing trades are one of the most difficult psychological challenges

Why Trading Mentorship Matters More Than Indicators
Learn Futures Trading With Structured Guidance, Confirmation, and Risk Management
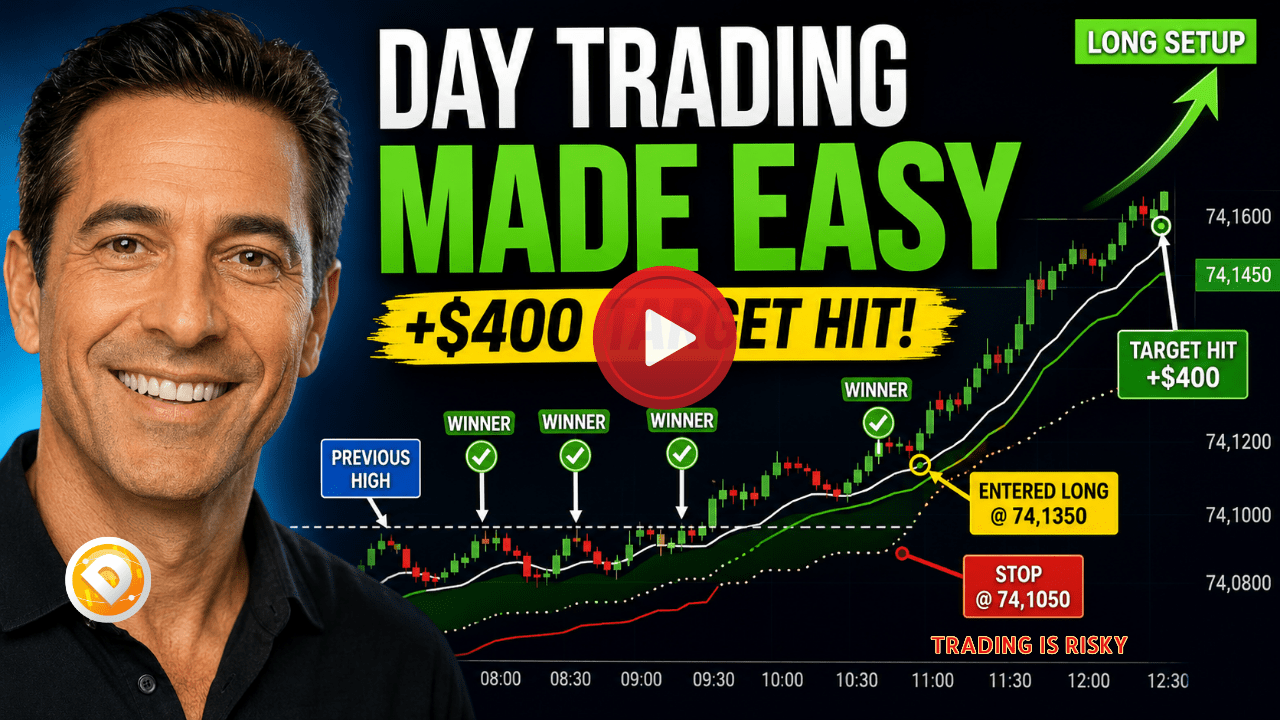
Money Making Friday: Live Futures Trade Using Price Action Confirmation
A Live Day Trade Start to Finish Friday mornings are

$300 Market Open Trades Explained – Day Trading Strategy Using MES & MNQ
The market open is one of the most powerful times
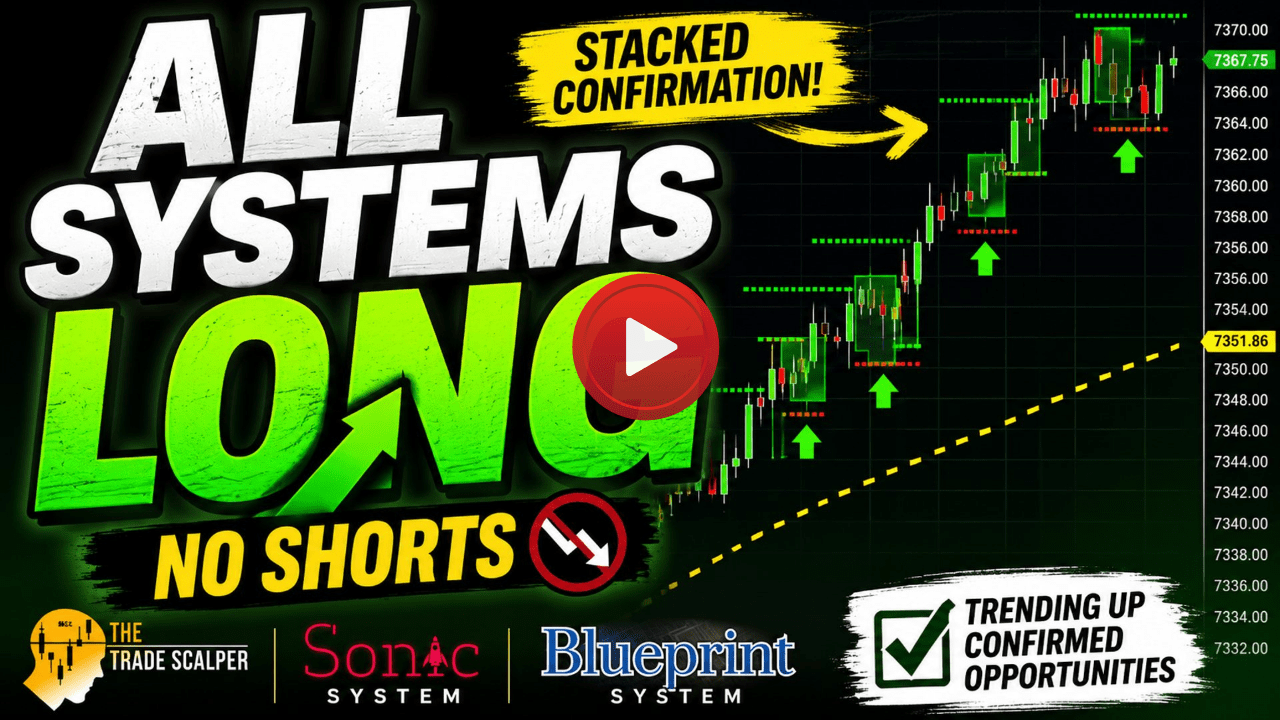
Buyers In Control: How the Market Is Moving Higher
And right now, one thing is clear: 👉 Buyers are
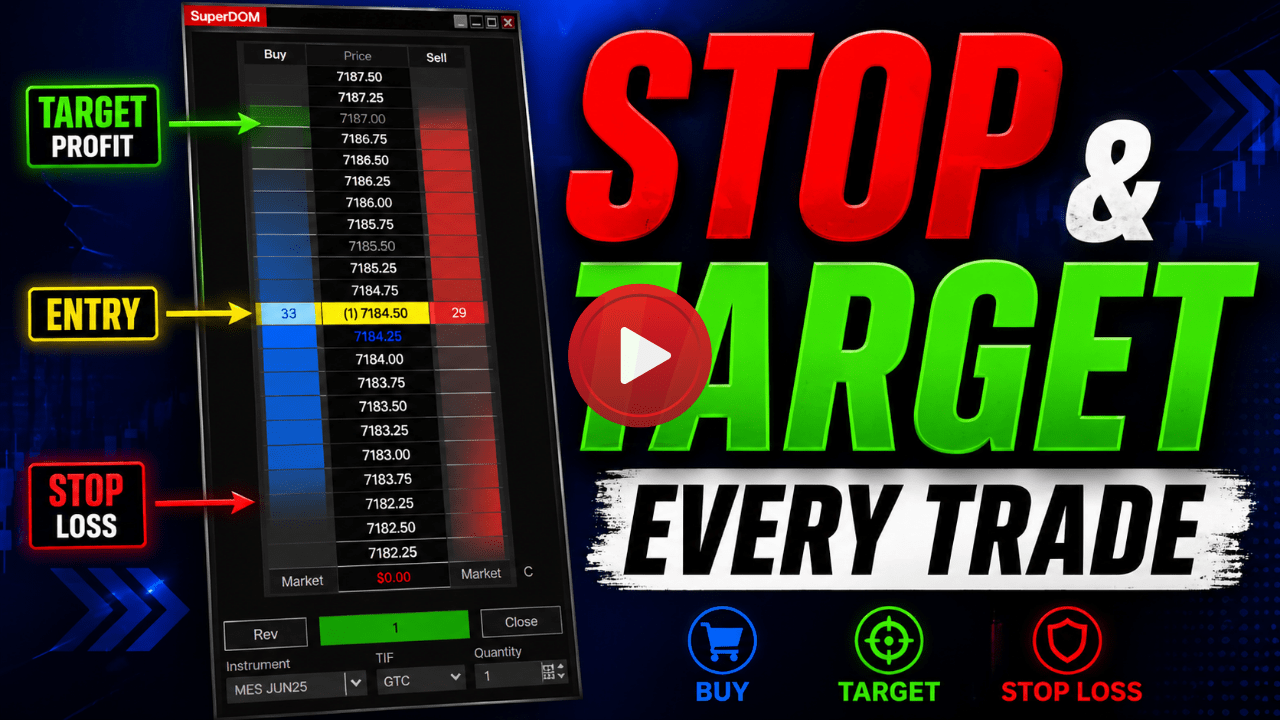
How to Place Trades the Right Way Using the NinjaTrader SuperDOM (Price Ladder)
f you’re placing trades without a clearly defined stop loss
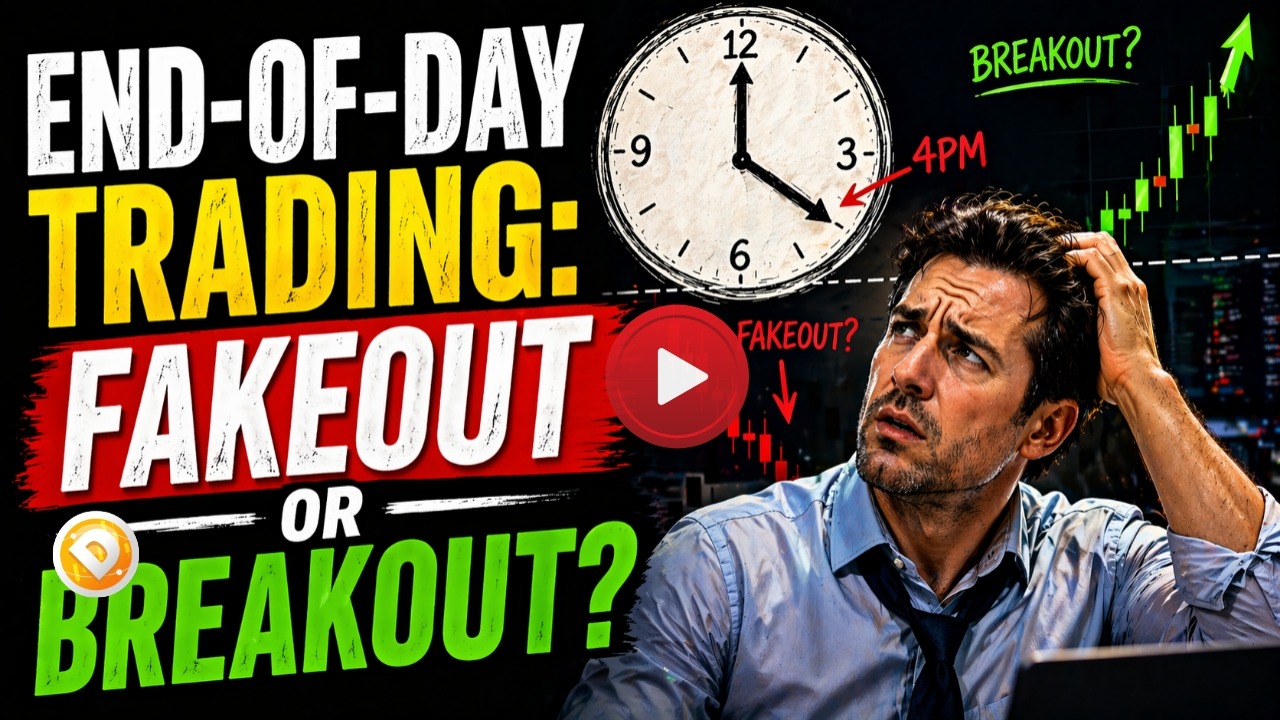
End-of-Day Trading: Fakeout or Breakout?
The final hours of the trading day is where decisions
How I Buy and Sell When Day Trading Stocks & Futures
Knowing when to buy and when to sell is what
Don’t Give Back Your Profits: How to Trade Smart
The Real Goal of Trading Isn’t Just Making Money Most
Day Trading All-Time Highs with Structured Signals (TradingView + NinjaTrader)
In today’s market, we’re seeing something traders wait for —
